How to Read Volume Profile in Quantower
Navigation
Volume Profile shows how much volume traded at each price over a selected period, making it easier to see where activity concentrated and where comparatively little trading occurred. Read as a map rather than a signal, it gives you a small set of useful references: the Point of Control, the Value Area and its boundaries, plus high- and low-volume nodes. This guide explains how to read those elements, what they can and cannot tell you, and how they behaved on real charts in Quantower.
What is Volume Profile?
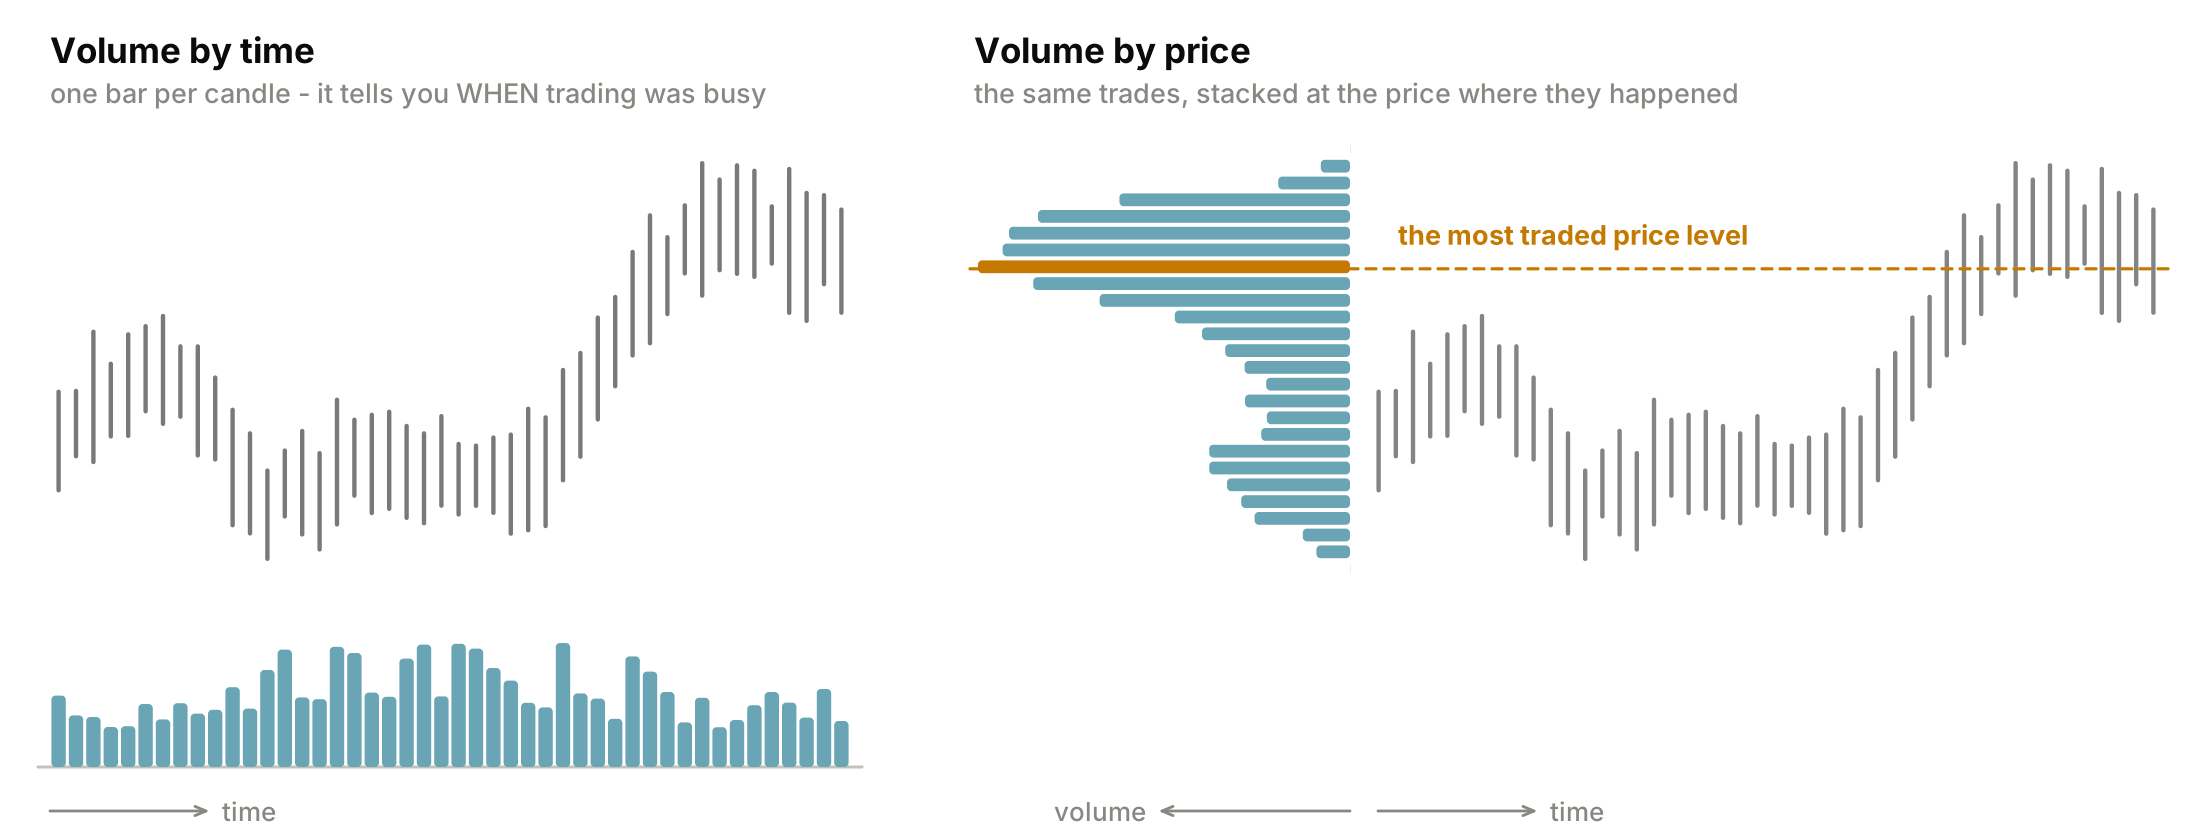
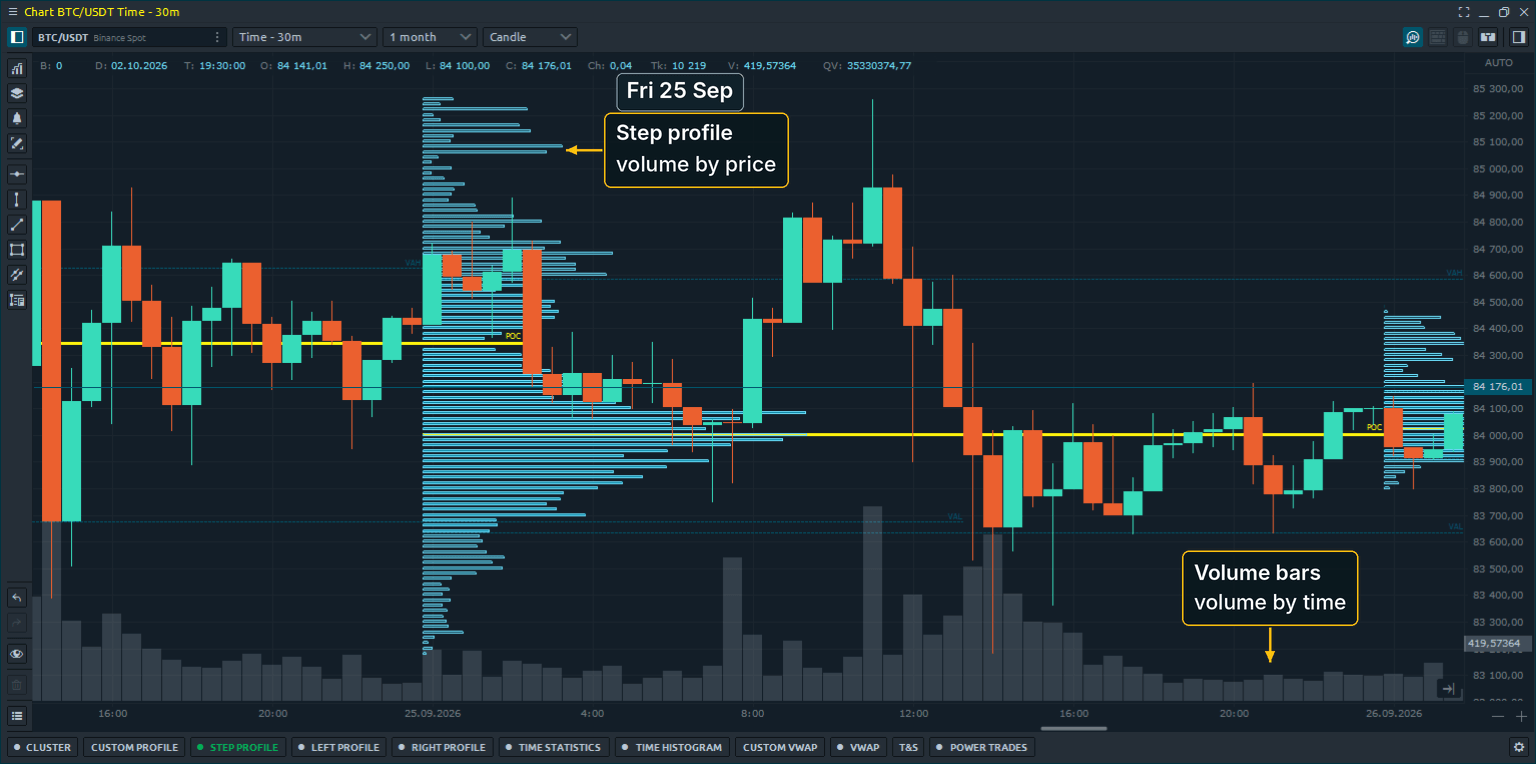
Volume Profile adds up traded volume at each price level over a selected period and plots the result as a horizontal histogram beside the price axis. This is volume at price: the longer the bar, the more volume traded at that price.
The volume bars below a chart group the same activity by time, one bar per candle. They show when trading was active. Volume Profile shows where that activity took place — at which prices the volume actually traded.
The idea is closely related to auction market theory: price moves through different levels as buyers and sellers interact. Some prices attract sustained trading and build volume; others see relatively little activity before price moves away.
One point matters before going further: a profile is a historical record. It shows where trading has already taken place; it does not predict what happens next. Its value is in identifying prices and areas that were important in the selected period so you can evaluate how the market behaves if it returns to them.
How to Read a Volume Profile
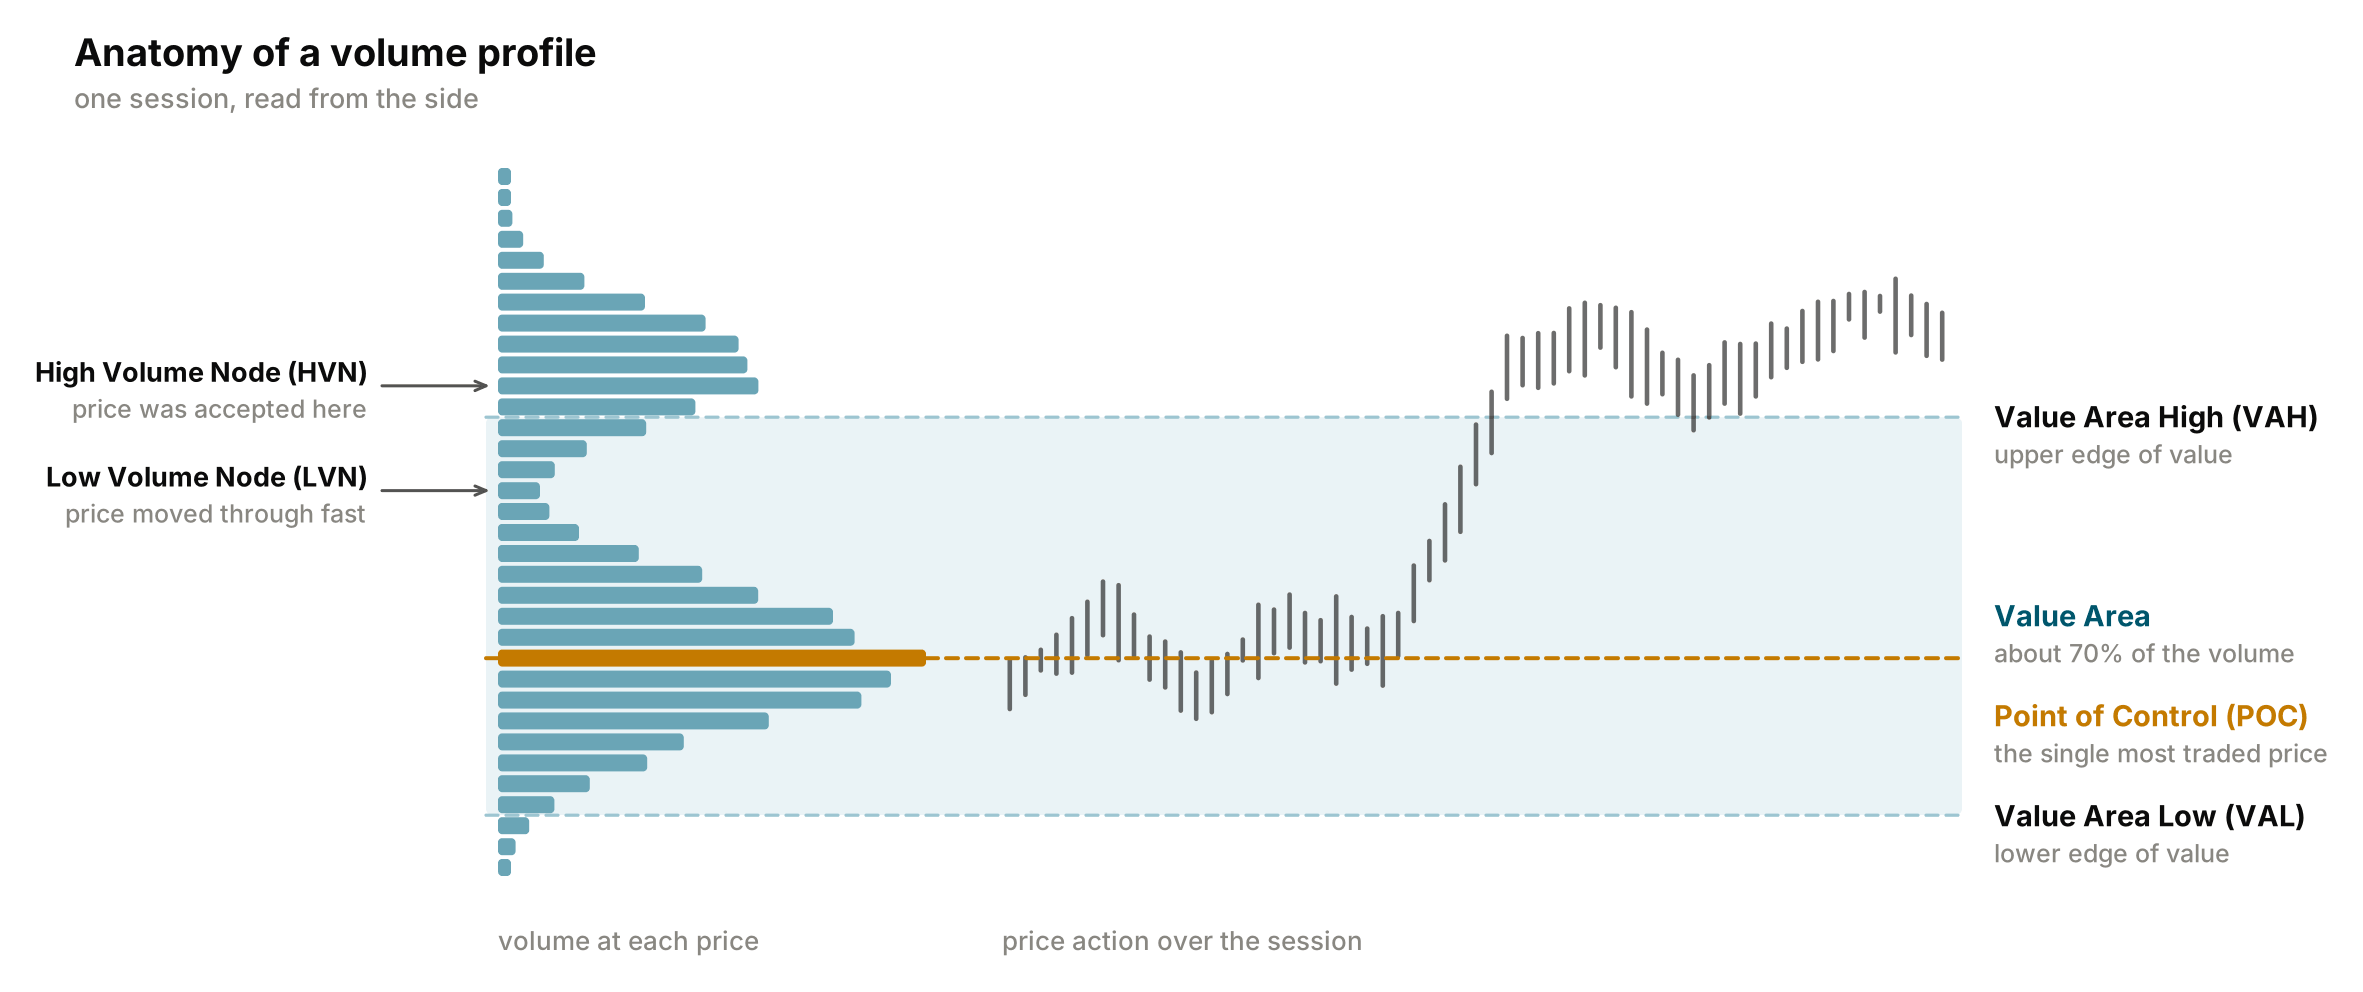
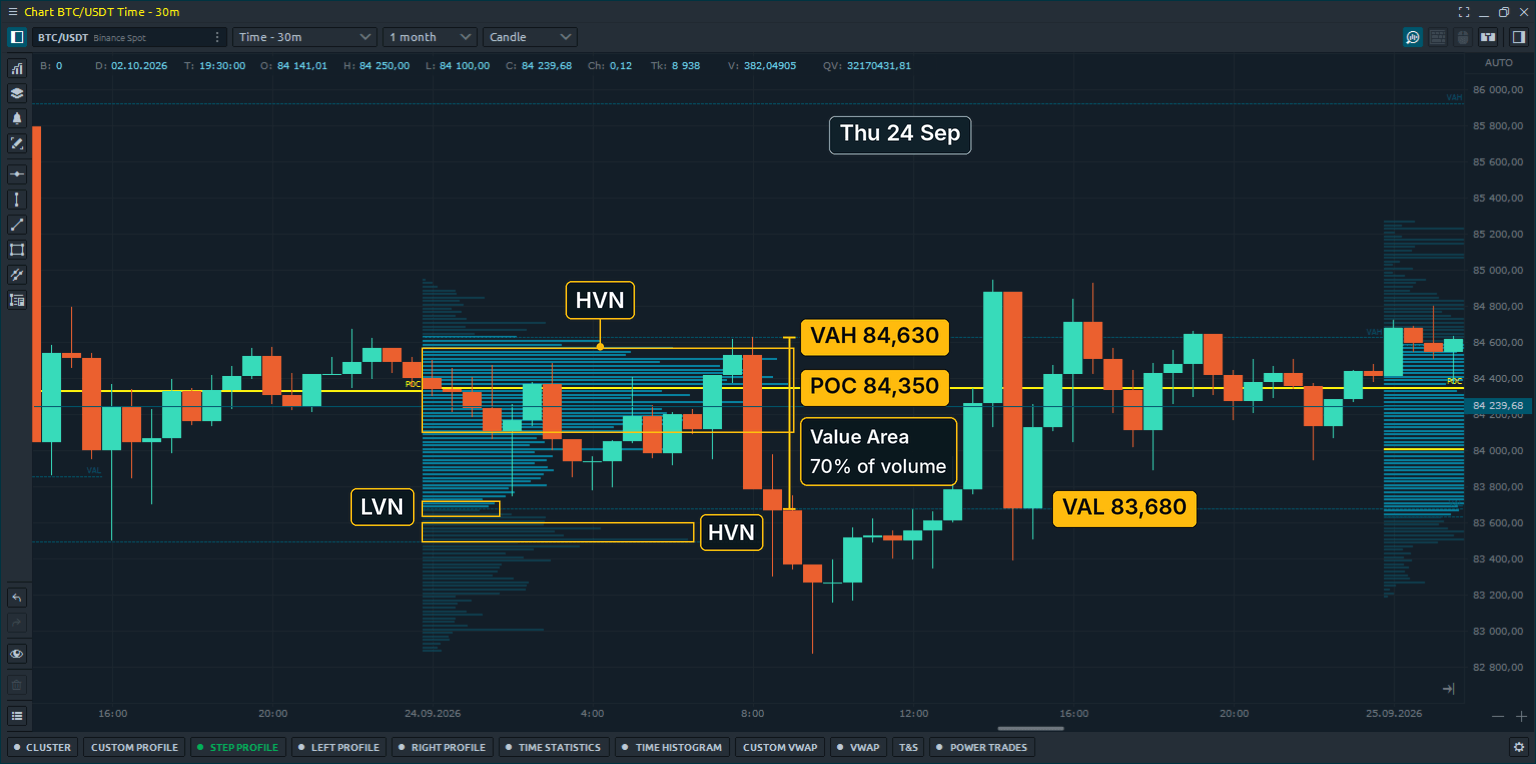
Start with the overall distribution, then locate the main reference points. The diagram below shows them on a schematic session, followed by the same elements on a real Quantower chart.
- Point of Control (POC). The price level, or profile row, with the highest traded volume in the selected profile. It is a reference for where trading was most concentrated. And definitely not a forecast of further movements.
- Value Area (VA). The range that contains a selected share of the profile’s total volume, commonly 70%.
- Value Area High (VAH). The upper boundary of the value area.
- Value Area Low (VAL). The lower boundary of the value area.
- High Volume Node (HVN). A broader area where relatively high volume accumulated. It shows that substantial trading developed there during the selected period. If price returns, watch whether activity builds there again or the market behaves differently.
- Low Volume Node (LVN). A relatively thin area where less volume traded than at neighboring prices. Price may have moved through it quickly, but the profile alone does not explain why. On a revisit, watch whether the area remains thin or begins to attract new volume.
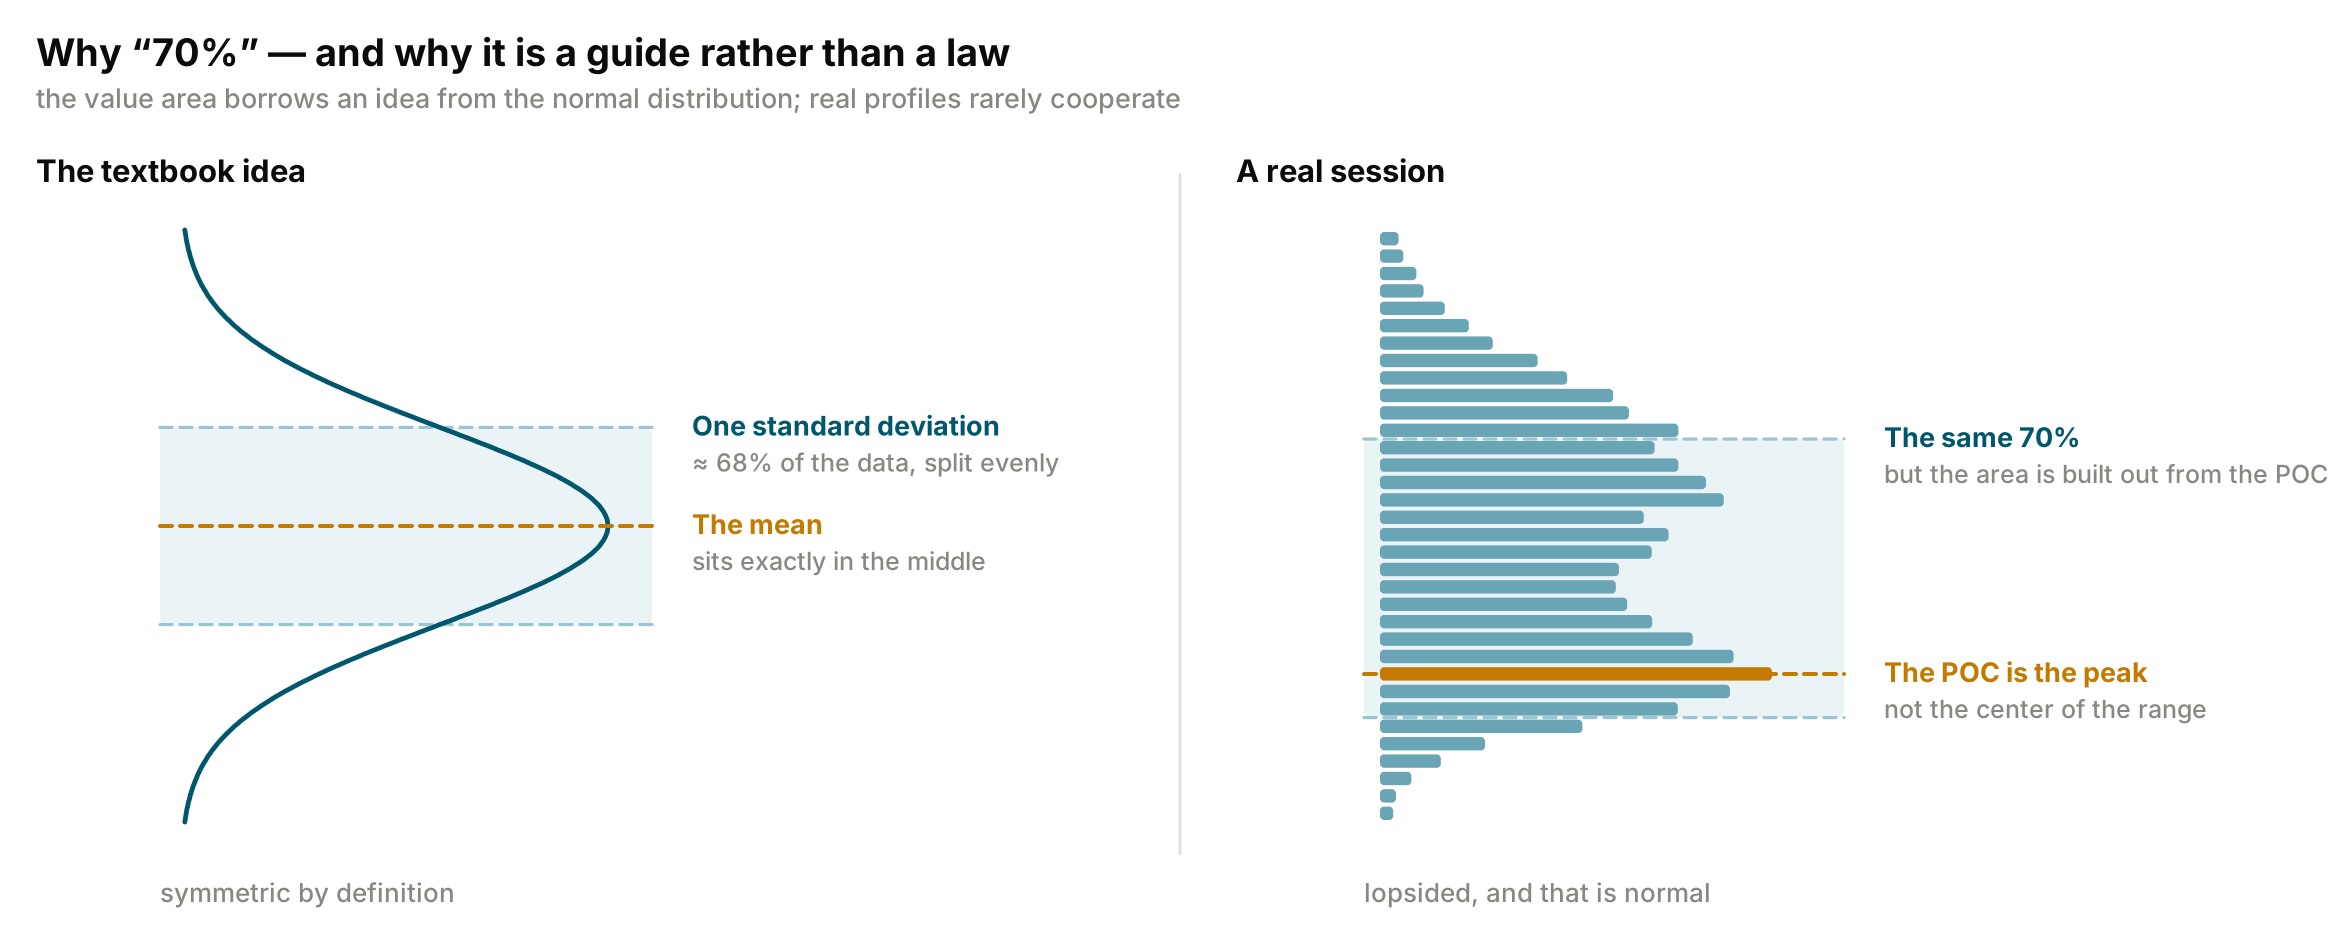
The 70% of Value Area is a profile convention rather than a law of market behavior. Some explanations compare it with the roughly 68% covered by one standard deviation in a normal distribution, but real Volume Profiles are rarely normally distributed. The percentage is also adjustable.
Acceptance and Rejection in Volume Profile
The main reference points describe a completed profile. Their practical value comes from what happens when price returns. If trading continues in an area and volume starts to build, that is evidence of acceptance. If price tests an area but does not sustain trading there and moves away, that is evidence of rejection.
That is why a move beyond VAH or VAL means little on its own. Price can move outside prior value without establishing a new area of activity. If trading continues there and the developing profile starts building volume at the new prices, the market is showing stronger evidence of acceptance. If price quickly returns to the previous Value Area, the earlier distribution remains the more relevant reference.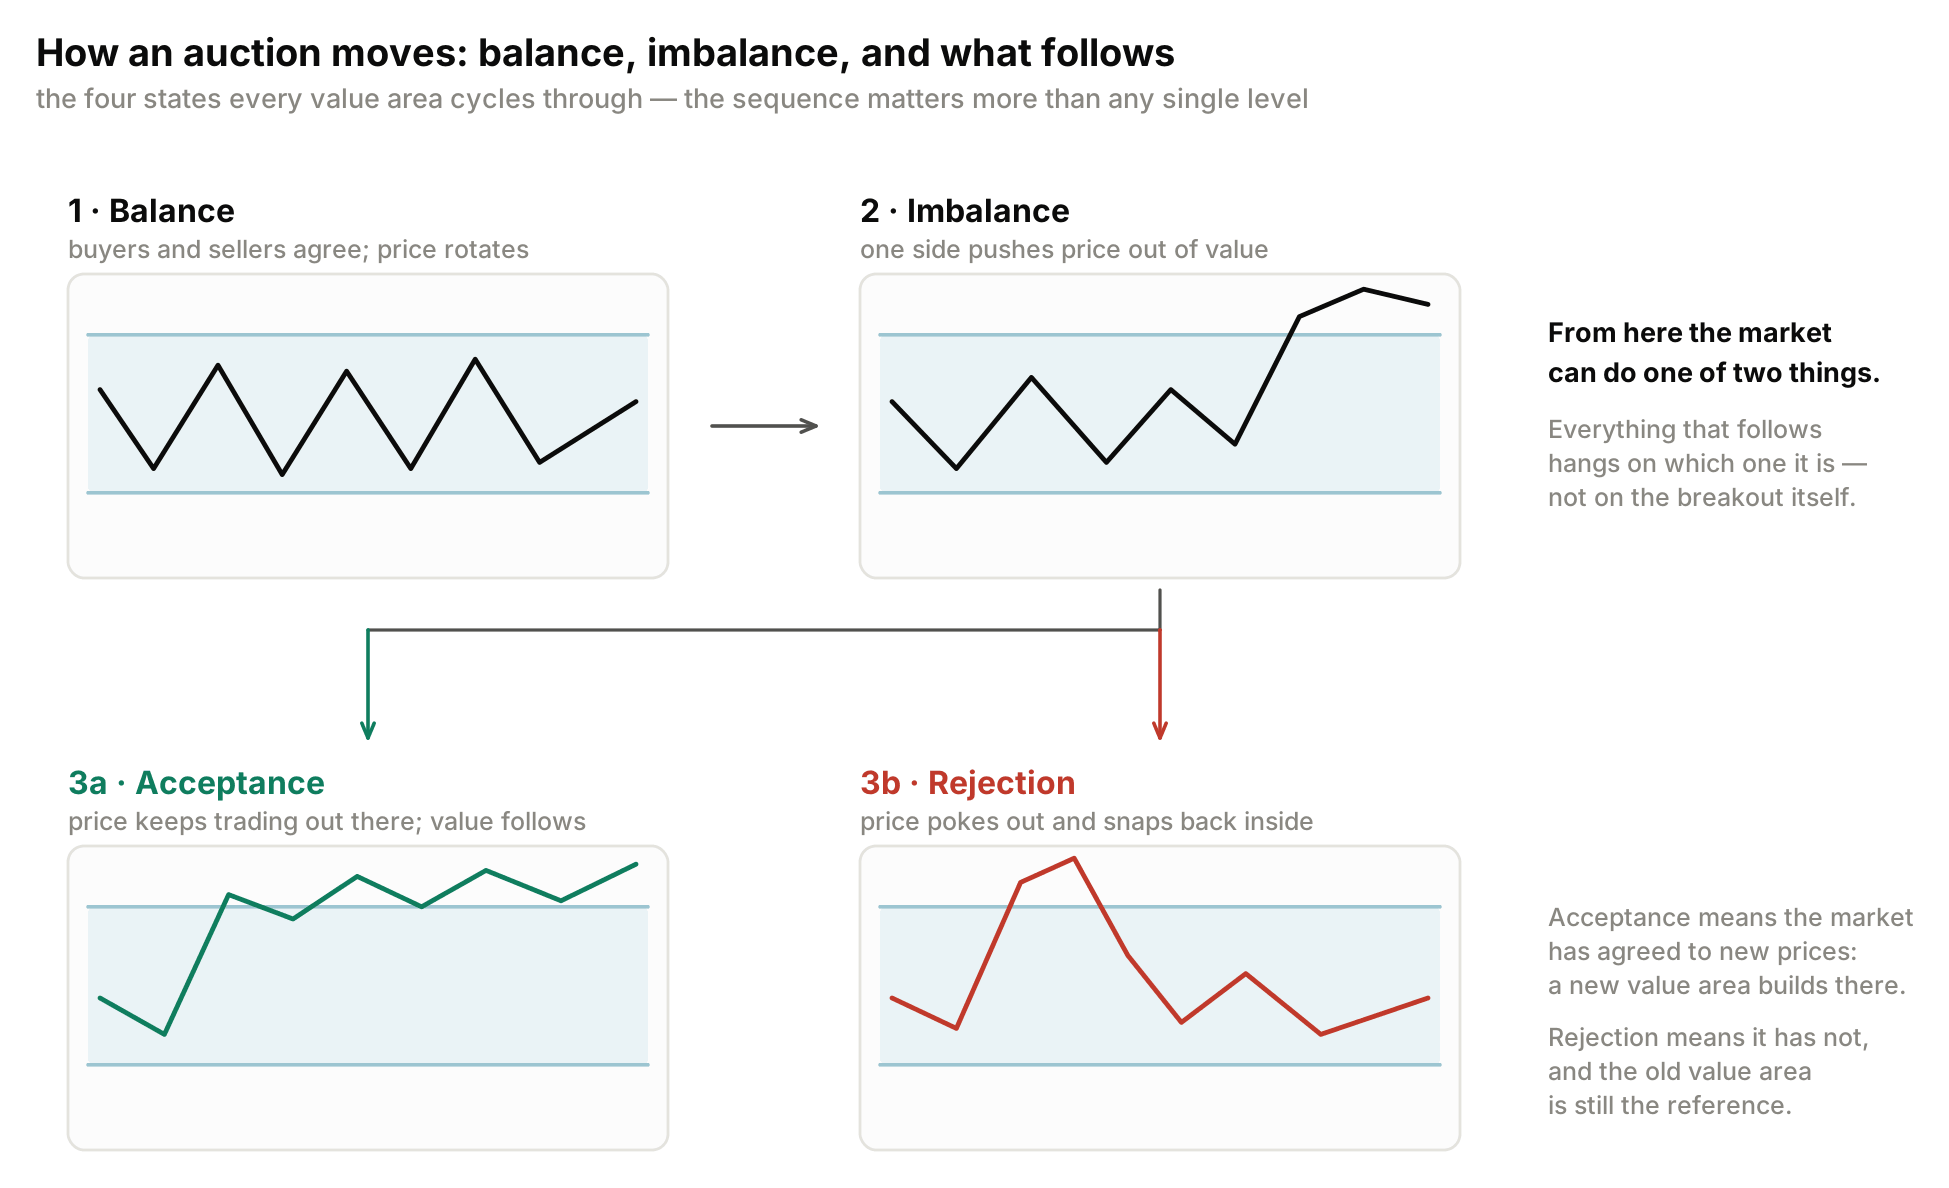
Neither outcome is a permanent property of the level. An HVN or LVN describes what happened during the period in which the profile was built; it does not guarantee the same response on the next visit. The current market has to be read each time again.
Previous Day vs Developing Volume Profile
On a live chart, traders often compare two profiles: a completed previous-session profile and the current developing profile. They answer different questions. The completed profile provides fixed historical references. The developing profile shows where volume is accumulating now, so its POC and Value Area can shift as new trades occur.
In Quantower, both can be displayed with Step profiles. The latest profile on the chart is still developing, while earlier profiles are complete. Traders often abbreviate developing levels as dPOC, dVAH and dVAL, and previous-day levels as PD POC, PD VAH and PD VAL.
| Previous day profile | Developing profile | |
|---|---|---|
| How it behaves | Fixed. The levels were set at yesterday’s close and do not move. | Redraws with every new trade. The levels move during the session. |
| What you read | PD POC, PD VAH, PD VAL | dPOC, dVAH, dVAL |
| The question it answers | Which key prices has the market already agreed on? | Where is the market forming value right now? |
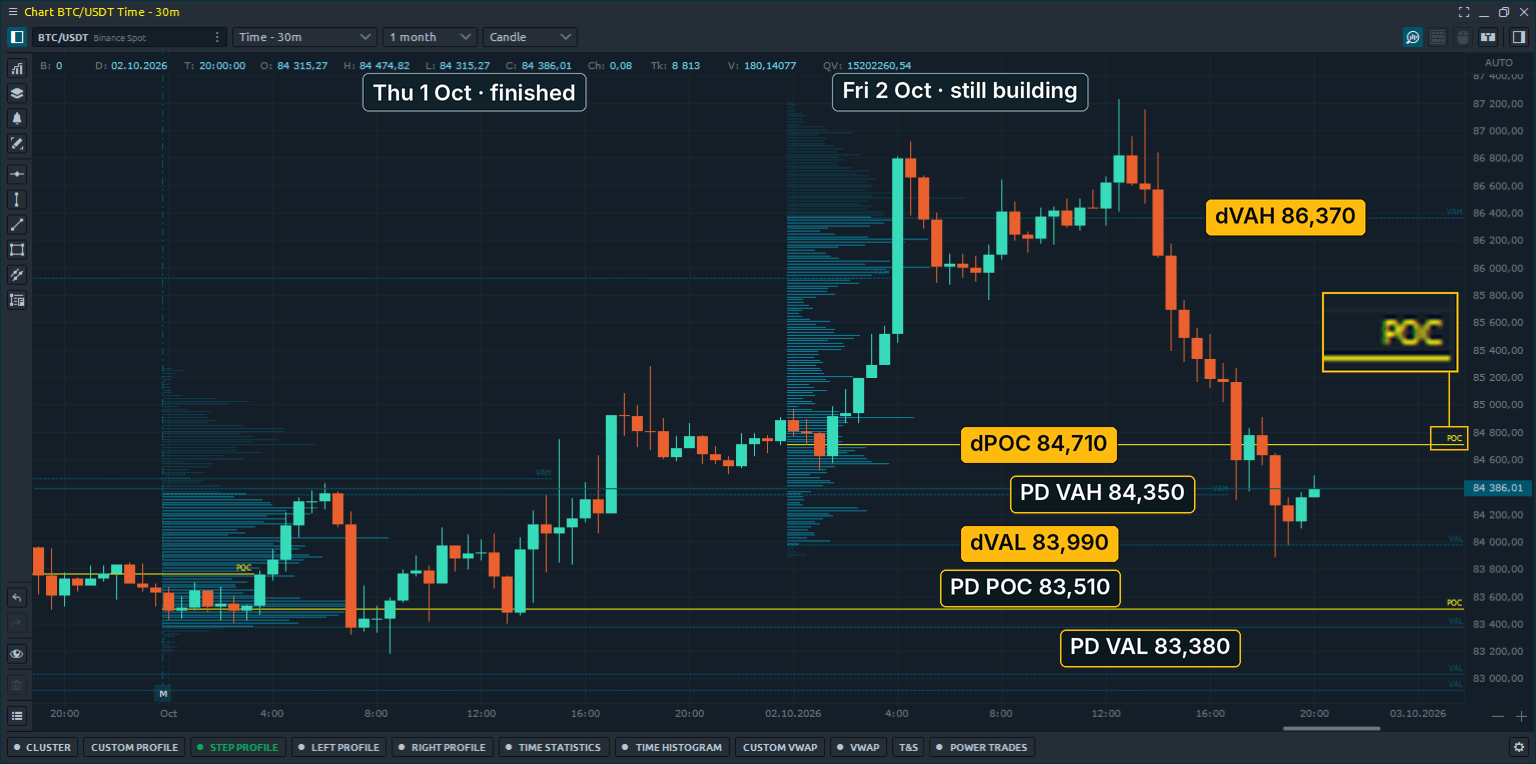
In the screenshot, Thursday’s value area shifted from 83,380 to 84,350, with the POC at 83,510. Friday opened above it, traded as high as 87,220 just after midday, and had fallen back through Thursday’s upper edge by the evening. At the time of the capture, Friday’s developing POC stood at 84,710 — and with almost four hours of the session left, it could still move.
The key distinction is simple: a completed profile gives fixed historical references, while a developing profile continues to change as the session unfolds.
Volume Profile Examples on a Real Chart
The reading process stays the same: first locate price relative to previous value, then identify the reference being tested, and finally observe what happens when price reaches it. The three examples below use BTC/USDT on a 30-minute chart in September 2026. Each day has its own Step profile, the levels are those drawn by Quantower, and the times are UTC.
Prior POC Retest
On Monday, 28 September, the heaviest trading was concentrated around 83,000, with the day’s POC at 83,010. On Tuesday, price returned to that area twice. It traded a few hundred dollars through the level early in the session, then tested the area again later. Tuesday’s own POC developed nearby at 83,170. On Wednesday morning, price revisited the same zone before rallying to 85,650 by early afternoon, a move that was largely retraced later in the day.
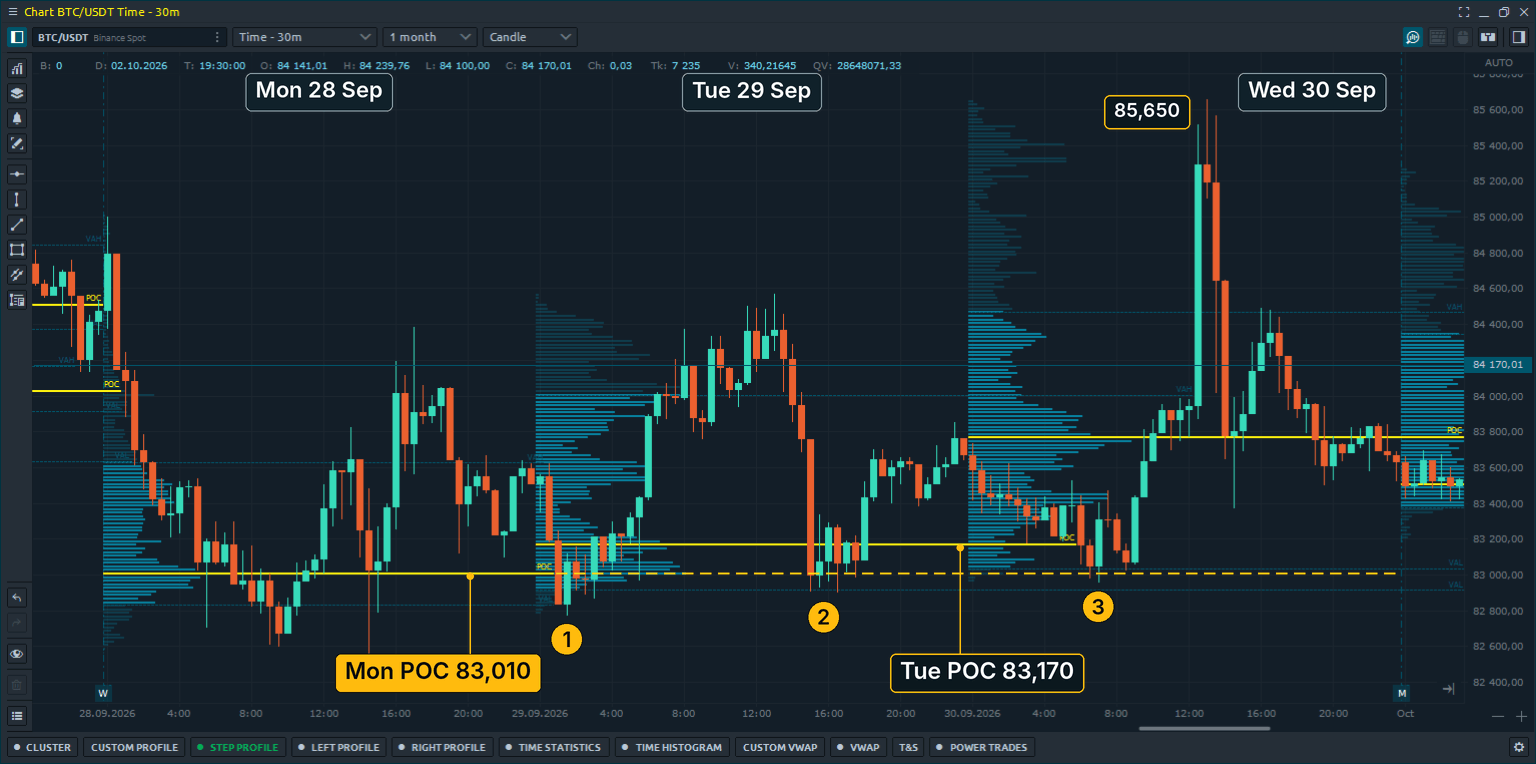
The POC did not cause the reaction. It simply marked the price where Monday’s volume was most concentrated. When price returned, the market again spent meaningful time around the same area. If price had instead moved through and begun building volume below it, the same historical POC would have carried a different message.
Value Area Boundary: Rejection vs Acceptance
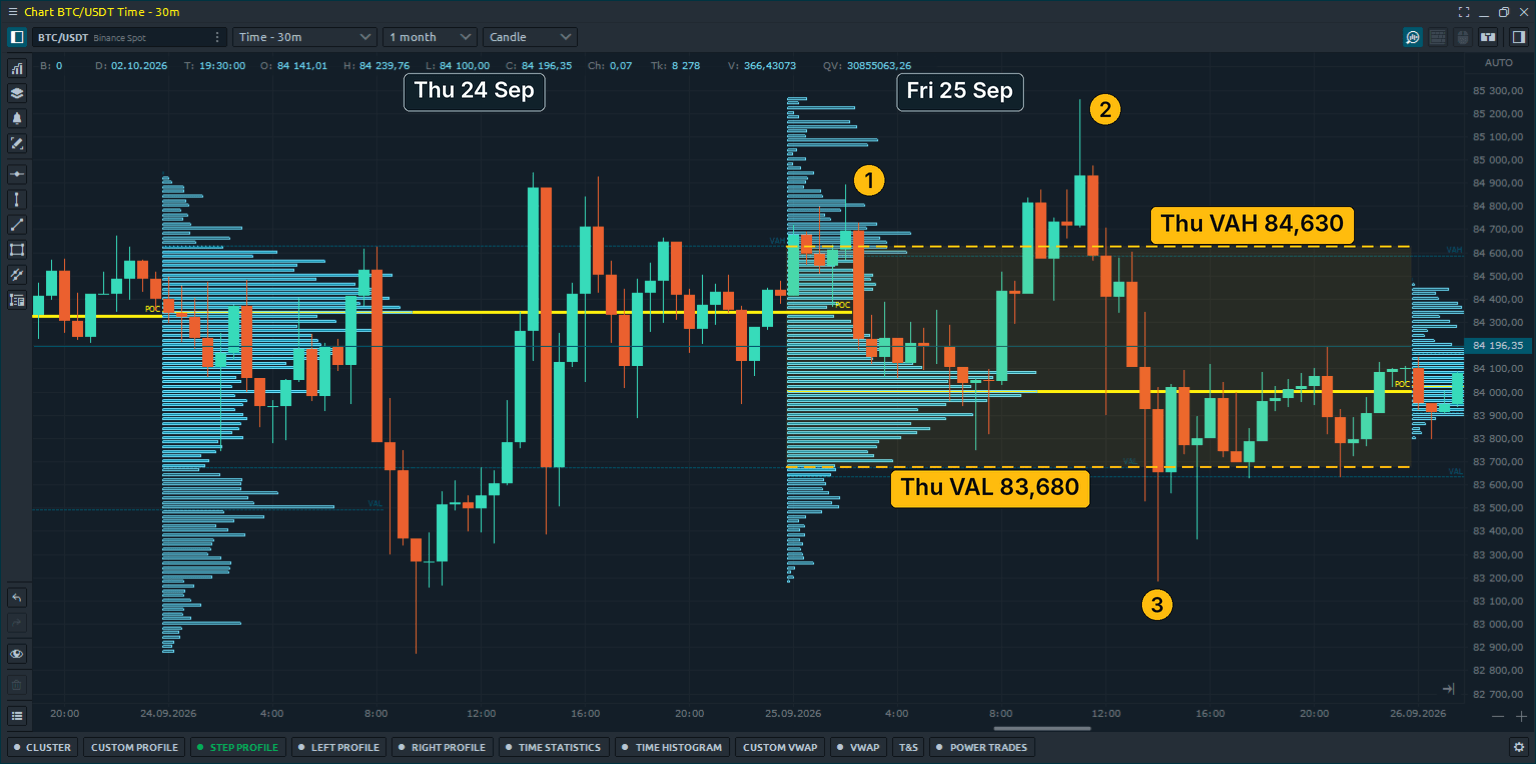
On Thursday, 24 September, the Value Area ran from 83,680 to 84,630. On Friday, price traded above the VAH twice — first after midnight and again in the morning, reaching 85,255 — but both moves returned inside the previous Value Area. Later, price tested below the VAL and again returned inside. In this session, trade did not remain outside either boundary for long, and Friday closed at 84,100, near the middle of Thursday’s Value Area.
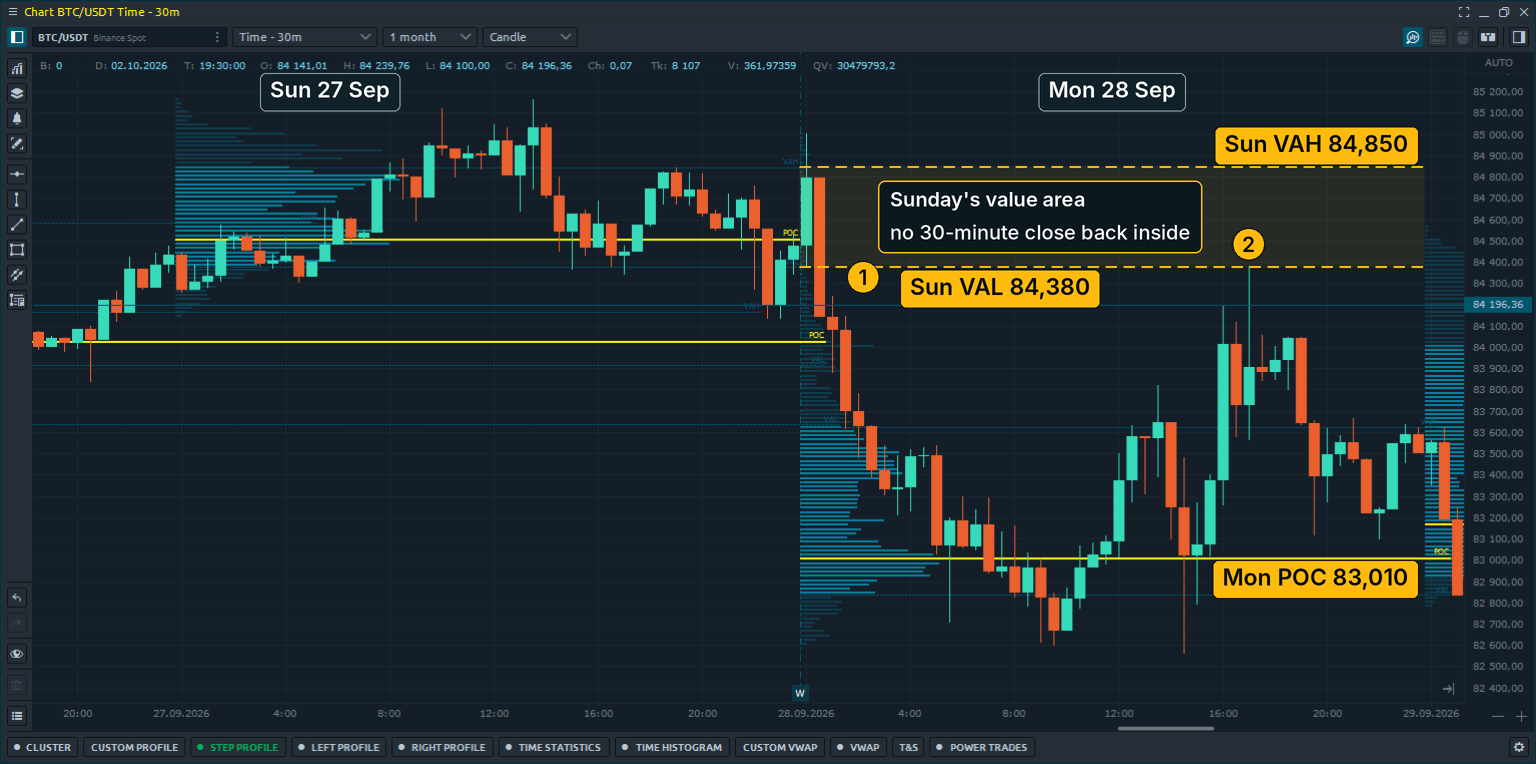
The following Monday developed differently. Sunday’s Value Area ran from 84,380 to 84,850. Monday moved below it in the first hour and did not re-establish sustained trade inside the prior range. Later, the developing session built its main volume concentration lower, with a POC around 83,010. The important difference was not the initial break of VAL; it was the fact that trading activity developed at lower prices afterward.
Former LVN Becomes Accepted
On Thursday, 3 September, the market rallied from around 77,000 to above 82,000. The fastest part of the move left a relatively thin area in the profile between roughly 79,000 and 80,400, where only a small share of the day’s volume traded. On Friday, price initially moved through much of that area quickly, then returned and stayed. More than half of Friday’s volume developed inside the former thin zone, and for the next three sessions the POC formed around 79,800–79,900.
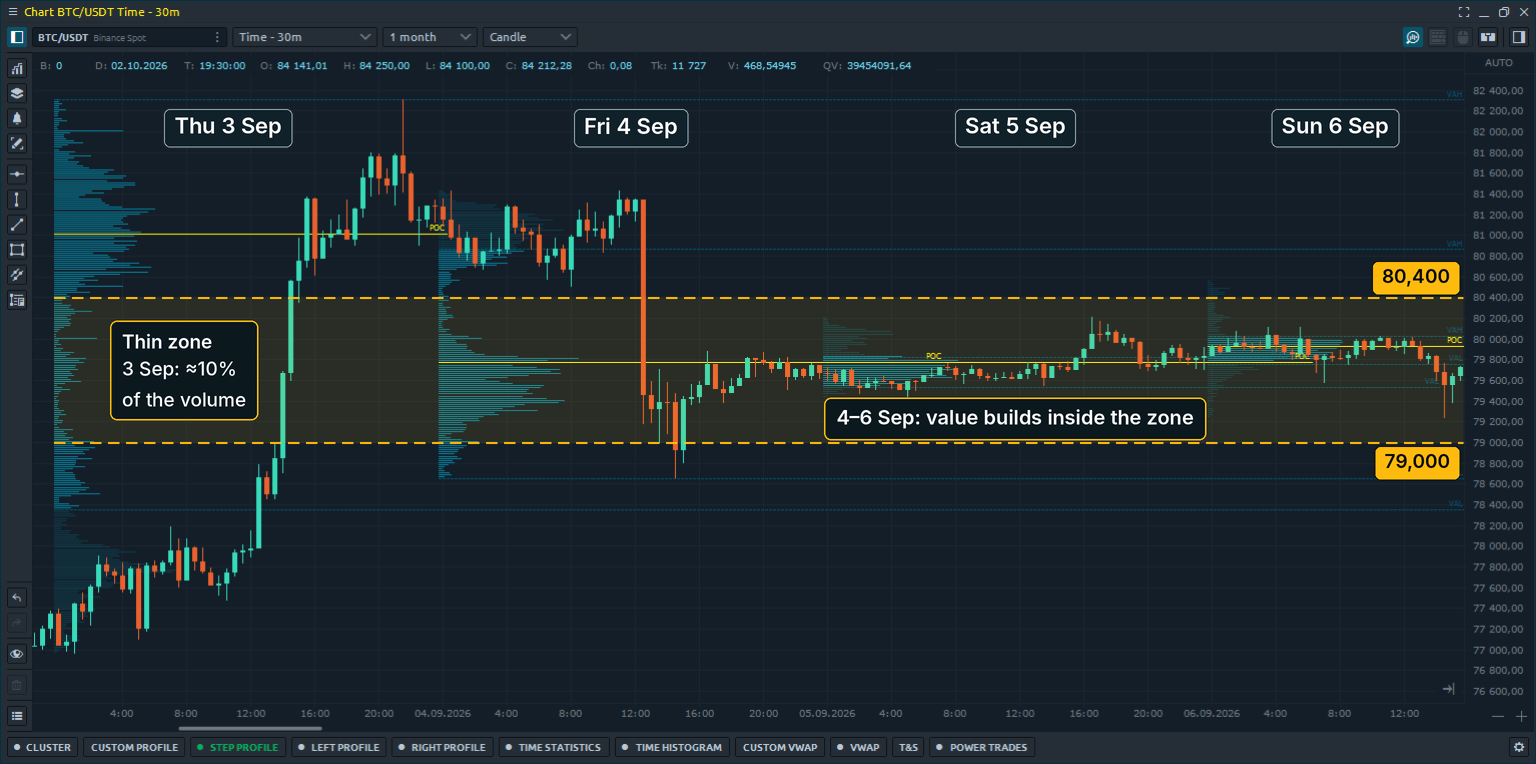
The earlier LVN described Thursday’s distribution, not a permanent market feature. Once later sessions began building volume in the same area, its role changed. This is the key lesson: historical profile structure matters only as long as current trading continues to treat it the same way.
None of these levels was a trade signal by itself. Each identified a location worth monitoring; the useful information came from the market’s response.
Common Volume Profile Mistakes
Most mistakes come from asking the profile to do more than it can. The following five are easy to avoid once you know what to look for.
- Treating the profile as a signal generator.
POC, VAH, VAL, HVNs and LVNs are reference areas, not entry points. The profile narrows down where to pay attention; price behavior and, when needed, order-flow tools help determine what is happening there. - Treating every reference as an exact entry price.
The POC itself is a specific price level or profile row, but a market reaction does not have to begin on the exact tick. Read the surrounding price action and liquidity rather than assuming the line must hold precisely. - Trusting a developing profile too early.
Early in a session, relatively little volume can move the developing POC and Value Area significantly. Treat early levels as provisional and give more weight to them as the distribution develops. - Not knowing what the volume represents.
On exchange-traded futures and centralized crypto venues, profiles can be built from executed trade volume when the data feed provides it. In decentralized markets such as spot FX, platforms may rely on tick volume or provider-specific data. Always check what your connection actually supplies before interpreting the profile. - Using Volume Profile on a market or session that is too thin.
In an illiquid instrument, a small number of trades can create nodes that look important but have little broader context. The same caution applies to unusually quiet sessions in otherwise liquid markets.
All five mistakes point to the same principle: Volume Profile is a record of past trading activity. Use it to organize context and identify references, not to turn historical volume into a deterministic forecast.
How to Use Volume Profile in Quantower
In Quantower, Volume Profile tools are available through Volume Analysis on the chart. The settings panel lets you choose the profile type, data type, step period, session template and display options. For a simple starting point, use a Step profile with one profile per day and keep the POC and Value Area visible.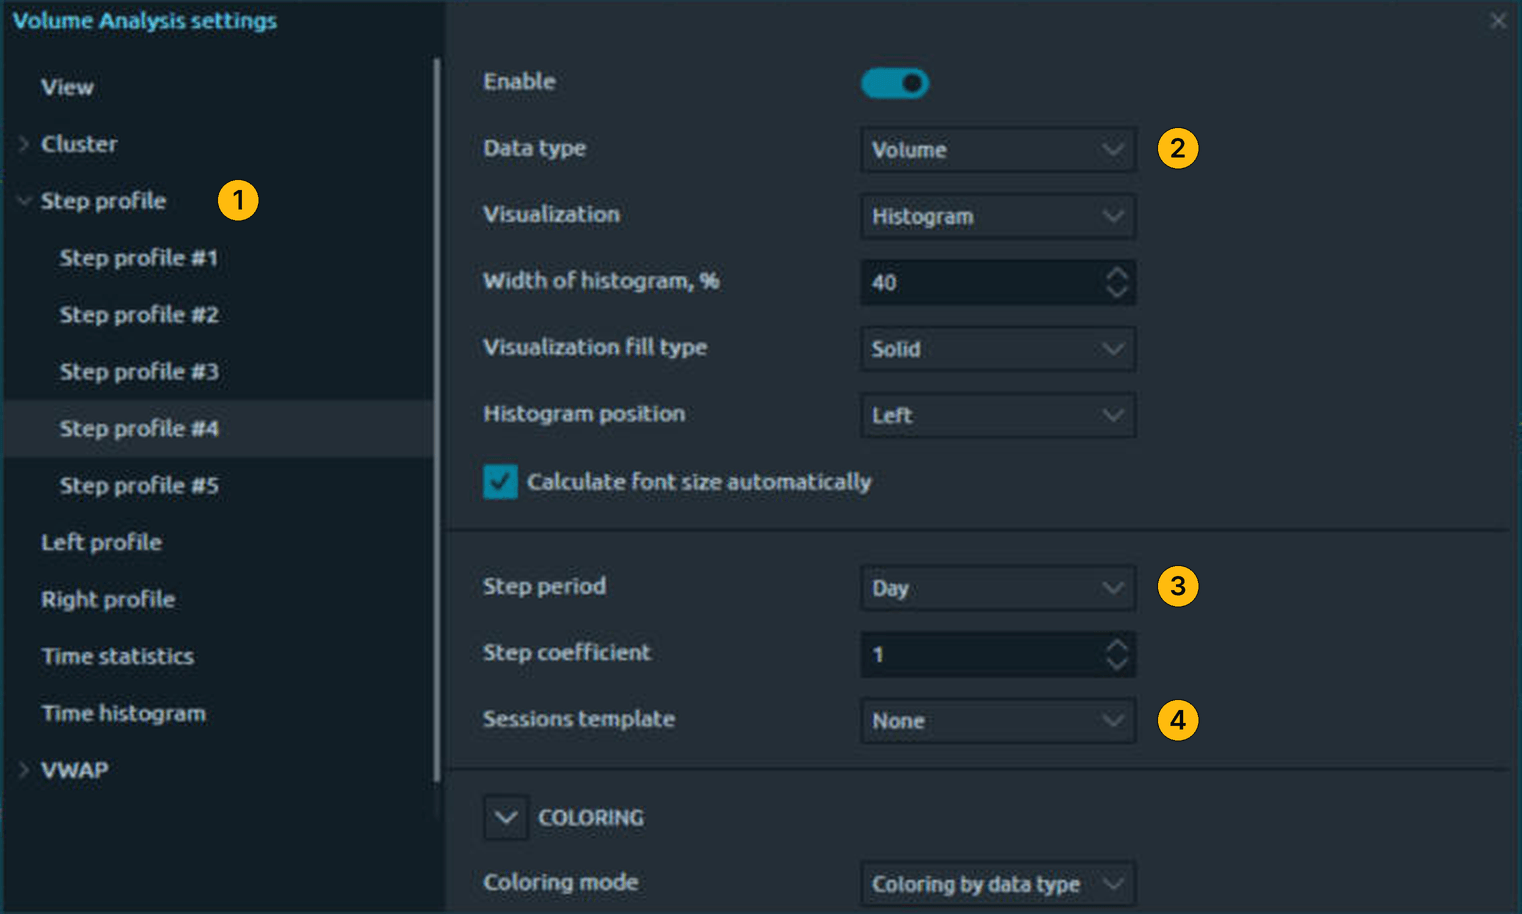
The POC and Value Area sections control the reference lines and labels. Value area height, % sets the share of profile volume included in the Value Area. POC intersection type and VA intersection type control how completed levels extend across the chart. In the View section, Custom step (ticks) controls the height of each profile row. The charts in this guide use the settings below:
| Section | Setting | Value |
| View | Custom step (ticks) | 2000 — 20 dollars per row on BTC/USDT |
| Step profile | Data type | Volume |
| Step period | Day | |
| POC | POC intersection type | Until Bar |
| POC | Show POC label | On |
| Value Area | Value area height, % | 70 |
| VA intersection type | Until Bar | |
| Show VAH label, Show VAL label | On |
Quantower provides Step, Left, Right and Custom Volume Profiles. Step profiles create separate profiles for repeated periods such as days. Left and Right profiles place a profile at the chart edge for a selected range. Custom Volume Profile lets you draw a profile over a specific part of the chart.
Keep the first chart simple: one profile, the POC and the Value Area. Add more detail only when it answers a specific question. A Cluster chart (footprint) shows executed Bid/Ask activity inside each bar, while Delta and Cumulative Delta show the difference between buyer- and seller-initiated volume. Volume Profile gives you location; these tools add information about the current interaction.
Volume Profile FAQ
What does Volume Profile show?
It shows how traded volume was distributed across price levels over a selected period. Longer rows represent more volume at that price; shorter rows represent less.
What is the Point of Control (POC)?
The POC is the price level, or profile row, with the highest traded volume in the selected range. It is a historical reference, not guaranteed support or resistance.
What is the Value Area, and why is 70% commonly used?
The Value Area contains a selected share of the profile’s total volume, commonly 70%. The percentage is a convention and can be changed; the exact boundaries also depend on the platform’s calculation method and settings.
What is the difference between a developing profile and the previous day profile?
The previous day profile is finished, so its POC and value area are fixed. The developing profile belongs to the session still in progress, and its levels keep moving until that session closes.
How is Volume Profile different from Market Profile?
Volume Profile organizes traded volume by price. Market Profile, commonly displayed as TPO, organizes time spent at price. They describe market activity from different perspectives and should not be treated as interchangeable.
Does Volume Profile work on forex and CFDs?
It can, but the meaning of “volume” depends on the data source. Spot FX has no single consolidated exchange volume, so many feeds use tick volume or provider-specific data. CFDs can also vary by broker and feed. Check the data type supplied by your connection before interpreting the profile.


Comments