Meet Barchart, reworked Market Heat Map, and TD Sequential indicator
Navigation
Quantower platform has just received a new update with a reliable data feed "on board", a new indicator, and a completely redesigned and improved panel.
So, what are we talking about?
- A new market data provider — Barchart
- TD Sequential indicator
- Completely reworked Market Heat Map panel
- Ability to create a screenshot from any panel
Let's explore these features in details!
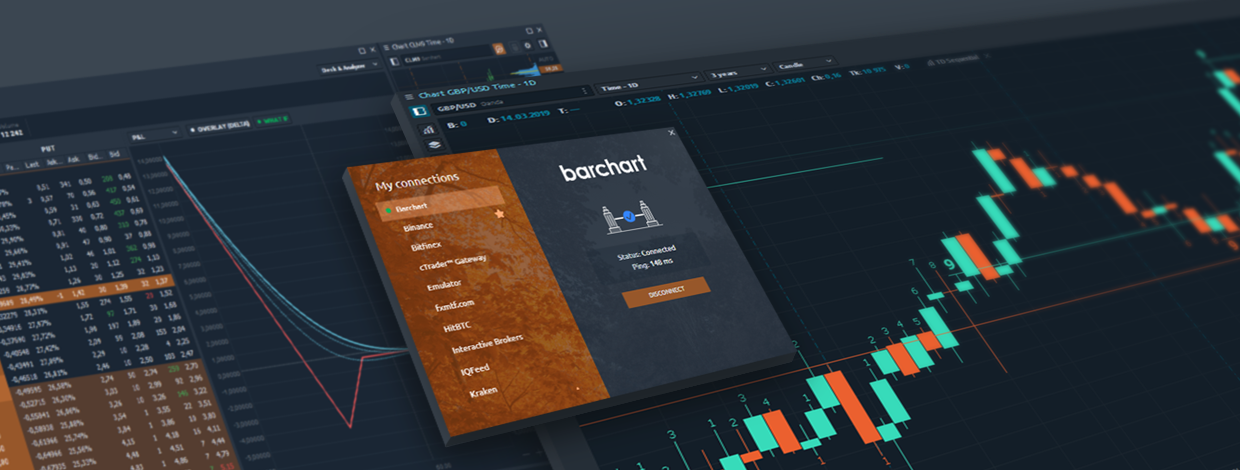
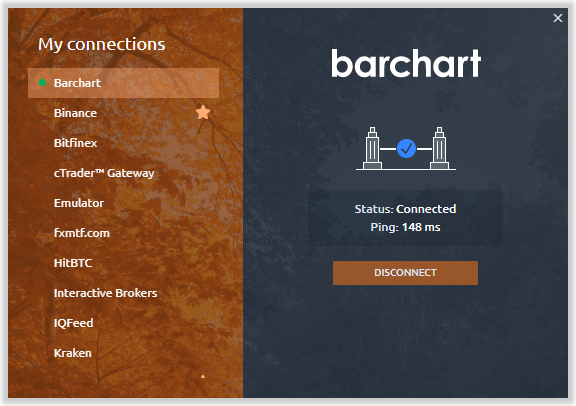
Barchart data feed is available in Quantower platform
With each new release, we not only expand the platform's capabilities but also add new trading tools and exchanges. Today we are pleased to introduce you Barchart — a leading provider of market data and services to the global financial and commodity industries.
Barchart provides historical and real-time data on a wide range of instruments, including global equities, ETFs, Indices, Futures, Options, Bonds and Forex.
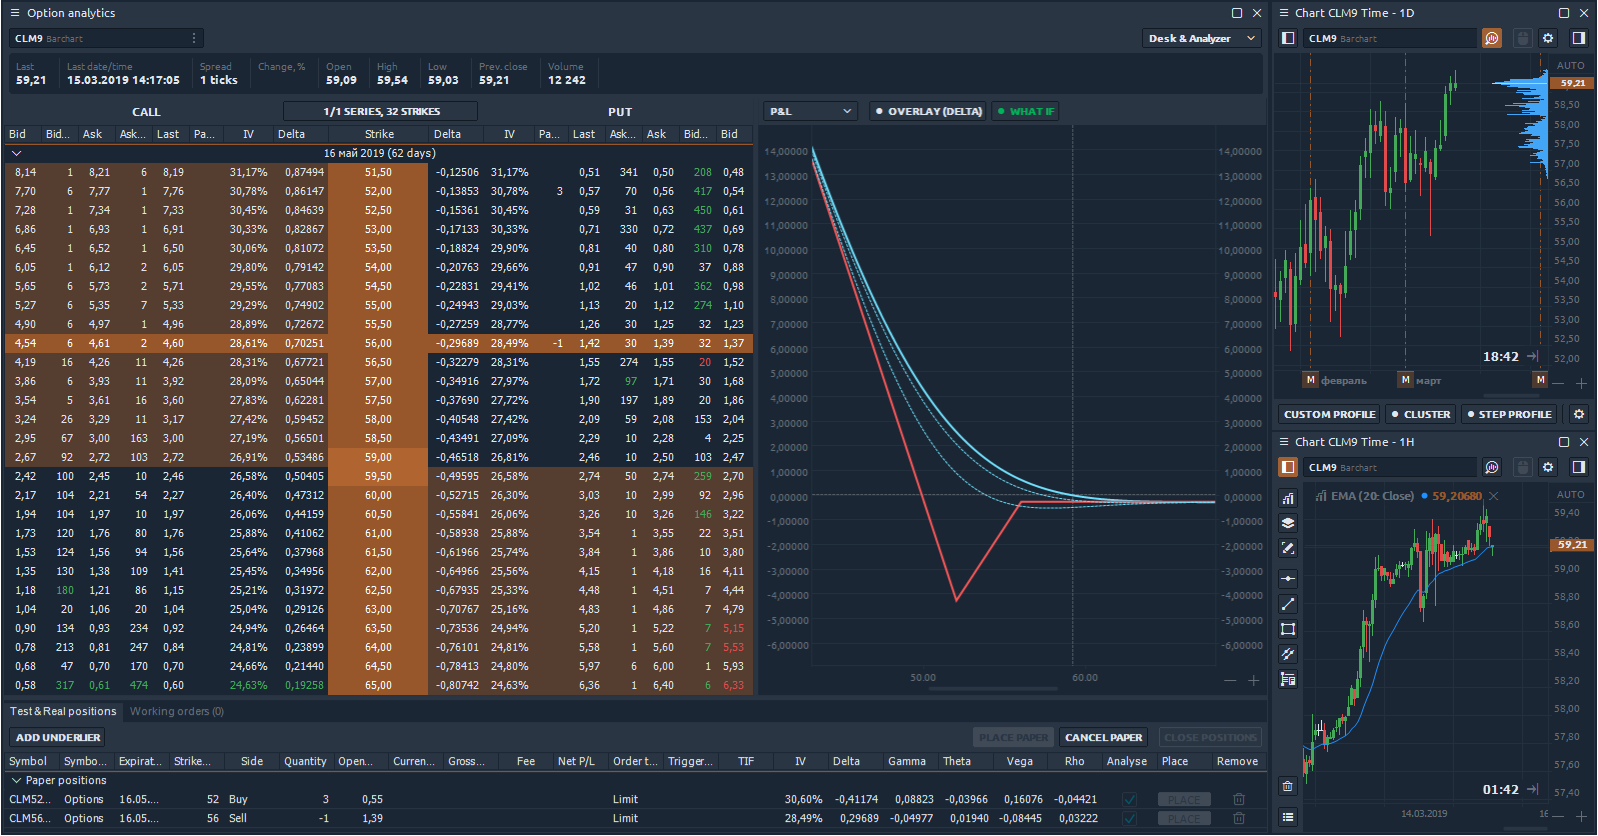
Besides, traders get the opportunity to work with the whole platform functionality, including cluster charts, volume analysis tools, Time & Sales, DOM and Option Analytics using real-time data.
A complete list of supported exchanged is available here.
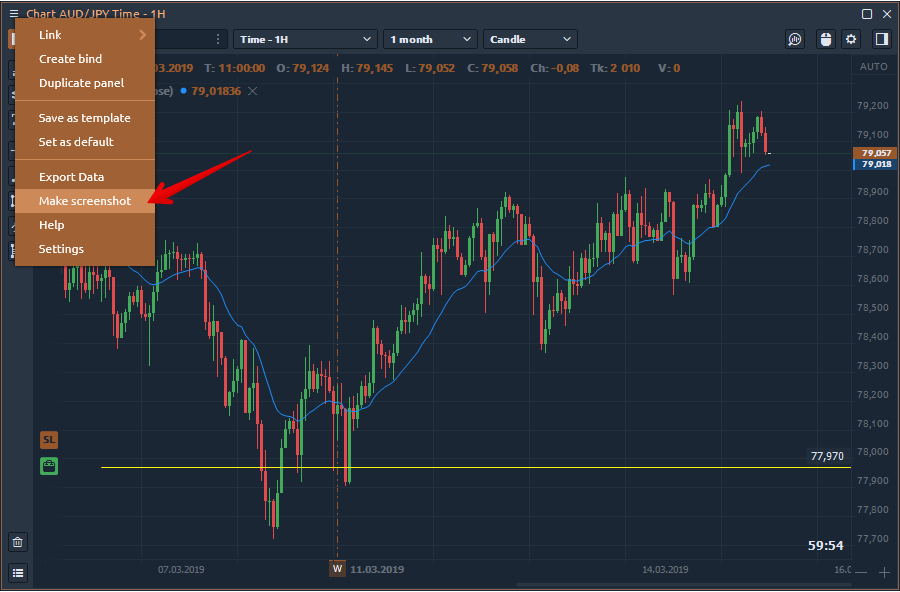
Make screenshot from any panel
We’ve added an option to create a screenshot directly from the panel for further sharing it via Telegram, Facebook, Twitter, StockTwits or other social channels. Once you have prepared an analysis of the current market situation or the state of your portfolio, make a screenshot and share it to your community.
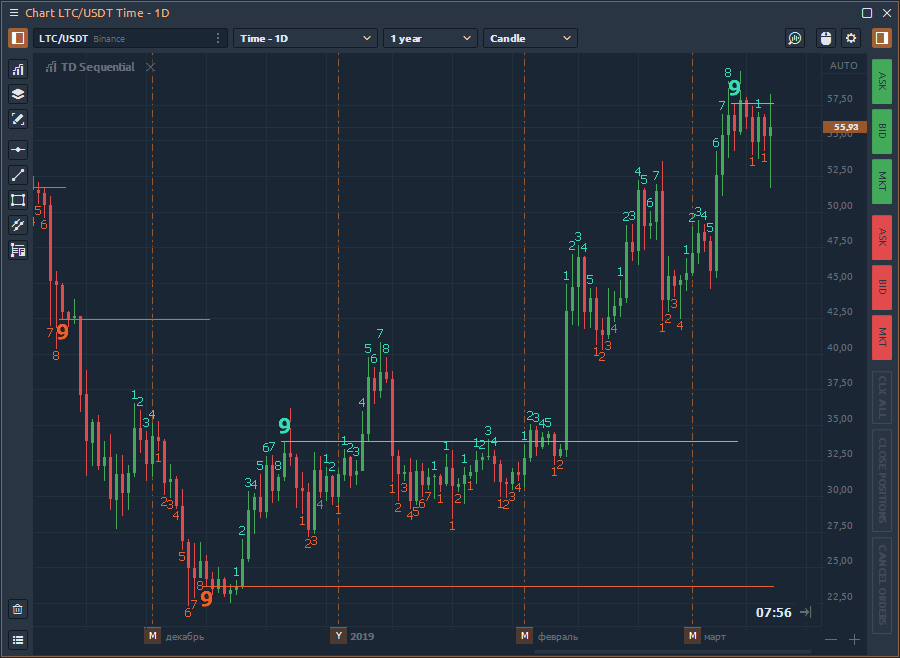
TS Sequential indicator
New indicator TD Sequential originally developed by Tom Demark, shows the completion of local trends, helping to determine the decay moment of the trend and the moment of reversal.
TD Sequential consists of three parts:
- TD Price Flip is a signal for a potential reversal.
- TD Setup which indicates where the beginning of the new trend, and where is only a correction within the current direction. It compares the current close with the corresponding close four bars earlier. There must be nine consecutive closes higher/lower than the close four bars earlier.
- TD Countdown counts the length of the trend to determine the decay of the trend and the formation of a new cycle
Please try how it works and let us know your feedback and suggestions.
Improved the Market Heat map panel
First of all, we have increased the panel's performance, and as a result, trading instruments are added almost instantly! We have also added the possibility of multiple choice of cells to clear the list of unnecessary trading instruments (all or only selected ones).
We hope you enjoy diving into all the new features and thank you once again for your continued support…
English


Trade with Quantower
Download the latest stable version of Quantower application for Windows for free and without registration
Comments