Introduction to forward curve and how to use it in practice
Navigation
Hello friends, in today's article I would like to discuss with you an interesting topic - Forward curve. What is it? What is it used for and how can it be useful for a trader in his daily practice?
But first things first. Let's start by defining what futures and forward are.
Futures is a derivative that obliges the purchase / sale of the asset underlying the futures on the date and at the price set at the time the futures contract was concluded.
The futures contract is always standardized by the exchange, the last trading date of the futures contract is called the expiration date. In the most common case, futures involve the delivery of a fixed amount of an underlying asset.
For example, grain futures means that at the end of the contract the buyer must pick up the prescribed number of bushels of grain, and the seller, in turn, deliver the grain to the buyer. The asset delivery period is designated as Maturity period.
Forward repeats the definition of futures, but unlike it is not standardized by an exchange. In practice, this means that the parties of this agreement have the opportunity to set an arbitrary period, as well as agree on an arbitrary amount of the asset if the forward is supposed to be deliverable.
In professional practice, futures are most often used to hedge exposure of a spot, commonly this need arises in the presence of currency risk.
Let’s consider an example. Suppose we have $ 10,000 and suppose that we want to invest these funds in cryptocurrency markets, let the price of conditional bitcoin be $ 10,000. So we can buy 1 BTC.
After buying 1 BTC, we automatically have a dollar risk, because we are now dependent on the change in the price of BTC / USD. We became dependent because at the end of the investment period we want to withdraw our USD back, but not ADA or XRP for example.
Accordingly, in order to do this, it will be necessary for us to sell BTC by receiving back USD, and we will sell it at a different price BTC / USD i.e. for the entire BTC holding period, we depend on the price of BTC / USD
In order to get rid of this risk, we need to hedge the USD exposure. We can achieve this goal by selling futures on BTC / USD in the amount equivalent to 1 BTC, i.e. 100% of all held BTC
After we sold the futures, we are fully protected from changes in the price of BTC / USD. In other words, wherever the price goes, we will not lose anything, moreover we will also earn the Futures Basis or the difference between the futures price and the spot price, absolutely without risk (if the future has an inverse structure)
This simple strategy is called Cash & Carry Arbitrage. Further in the article we will consider an example with real numbers. But at this stage, it is important for us to understand the general concept.
So, we have a portfolio of 1 BTC and -1 Future BTC, what does this exposure give us? First of all, as mentioned above, we are not dependent on changes in the price of BTC / USD, and this, in turn, allows us to trade any crosses against BTC without the risk of losing value due to a change in the price of BTC / USD.
Those, in other words, we can build speculative strategies on pairs like ETH / BTC, ADA / BTC, or any other that have the BTC as a quoting currency. All returns from speculating on assets against BTC are quoted in BTC, which we have already hedged against USD.
For example, having 1 BTC, we can buy X ADA by the signal of our trading strategy, once we receive an opposite signal we sell back held X ADA and return to the BTC exposure again, suppose our transaction was profitable and after selling X ADA we got 1.1 BTC, in this situation we have 0.1 BTC (our profit) appeared, which have a risk against USD.
This risk arises from the fact that we initially hedged 1 BTC by selling -1 Future BTC, now, after we made a profit of 0.1 BTC, we also need to hedge against this risk, so that we sell an additional number of futures and our exposure becomes 1.1 BTC, -1.1 Future BTC.
By repeating all the above steps, we can speculate on crosses against BTC while being out of the risk of a change in the price of BTC / USD. The portfolio of spot and futures must be held until the expiration date of the futures. Because on this date, the futures price is always equal to the spot price.
Bearing in mind the importance of hedging, there is a question - how to choose the right futures that you want to use?
An attentive reader will notice that in our portfolio, the future is always a short position, the first obvious decision that comes to mind is to choose the future that has the highest price.
But it is not so simple! In addition to price, futures also have a circulation period. How to compare two futures correctly, if for example one has a price of 100 and an expiration date of 20 days, and the other has a price of 150 with an expiration of 50 days?
In order to properly answer this question, we need to be aware of the properties of the futures.
Basis - is the difference between the value of the futures and the spot price, if the basis is positive, this state of the futures is called contango. If the basis is negative, then it is generally accepted that the futures are in a state of backwardation.
The basis value is usually presented in the form of a relative value. In order to compare several futures with each other, it is necessary to compare their basis normalized to annual value.
The futures whose basis value is greater is more expensive. For hedging, you should choose the most expensive futures since it will bring us greater profitability over a holding time.
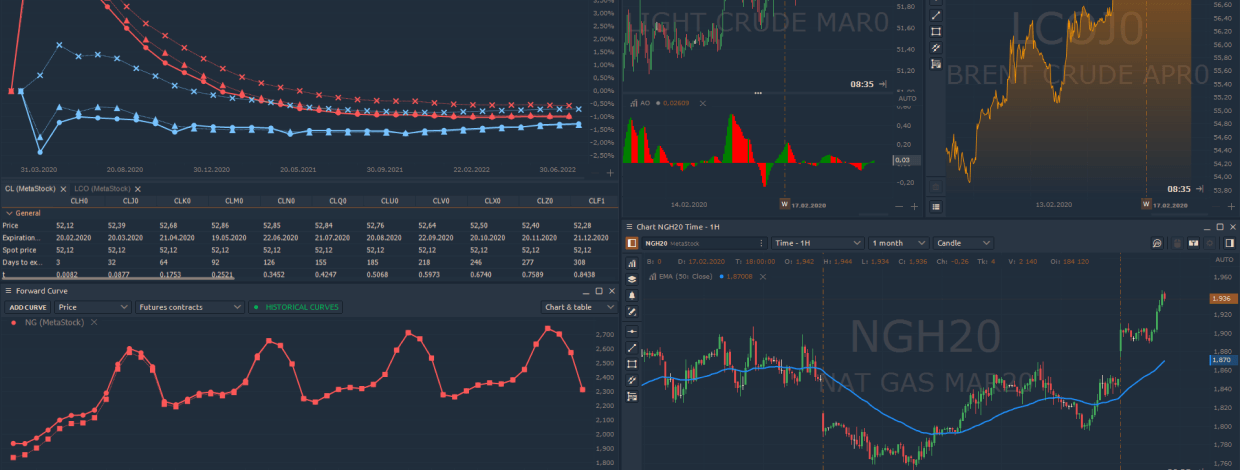
The Quantower platform has a very convenient and flexible Forward Curve panel, which allows you to analyze the futures structure of the selected instrument or several instruments.
Let's briefly go through the main toolbar of the panel.
The Add curve button allows you to add an asset for analysis, you can add several assets at once, which allows you to compare futures prices with each other.
The next combo box allows you to select the type of chart. The following states are available:
- Price
- Term structure.
In Price mode, the chart represents the absolute value of futures prices combined in one series of data.

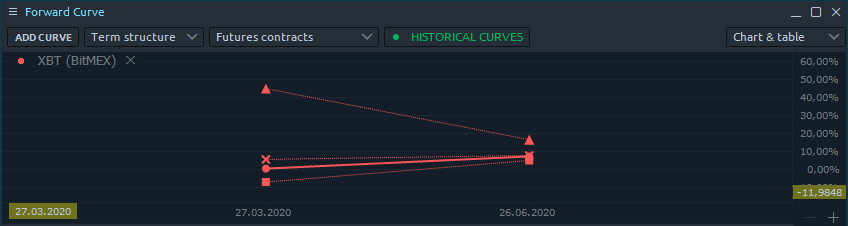
The Term structure mode displays information about the basis, normalized to an annual value.

The next combobox allows you to select the data type of the panel, the system supports the displaying information directly about futures and their calendar spreads. There are 3 possible states for displaying spreads:
- First contract spread
- Second contract spread
- Third contract spread
The panel also supports working with historical mode, which allows you to see the history of changes in the graph over time. The system allows you to build simultaneously up to 3 series of data
The bottom part of the panel is a summary table with statistical information about every future contract.
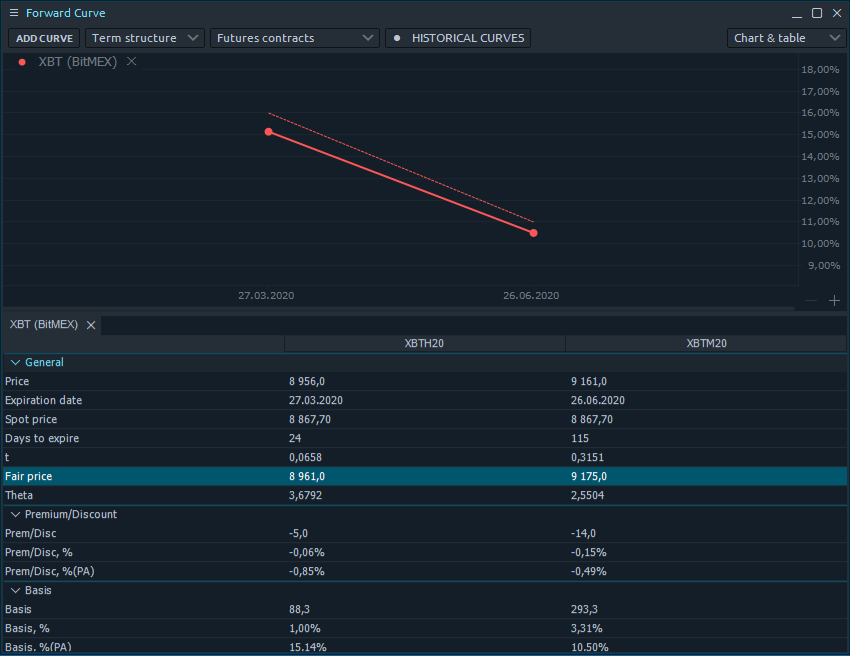
Let's go through all the information collected in the table. The General block contains common information for every future contract, such as: Price, Expiration date, Spot price, Days to expire.
The parameter “t” denotes the time before the expiration of the futures, normalized to an annual value. Fair price - represents the fair price of the futures, depending on the provider, this value can be calculated both by the panel itself or provided through the API.
Theta is a derivative of the futures price by time, in other words, this value shows how much futures will become cheaper in one day.
The Premium / Discount group shows the difference between the current futures price and its fair price. There are 3 characteristics:
- Prem/Disc - absolute value of difference
- Prem/Disc, % - percentage value of difference
- Prem/Disc, %(PA) - annualised value of difference
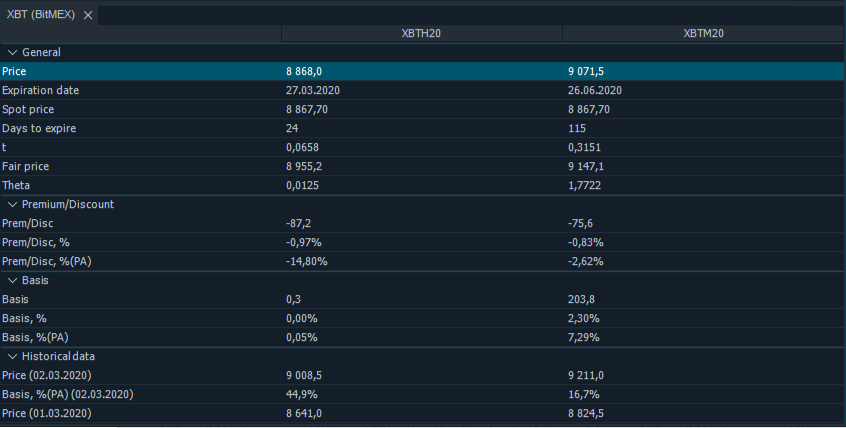
Basis group instead of previous one shows the difference between the current futures price and its spot price. There are also 3 characteristics:
- Basis - absolute value of difference
- Basis, % - percentage value of difference
- Basis, %(PA) - annualised value of difference
And the last group describes historical data such as Price and Basis,% (PA) for every added historical curve


Comments