Futures Trading Powered by Options Data
Navigation
Futures trading has changed. It is no longer enough to rely on price patterns, indicators, or historical support and resistance. A growing share of intraday movement is now driven by positioning in the options market, not just directional conviction in futures themselves.
Every option contract reflects a view on price, volatility, or risk. When that positioning builds at specific strikes, it creates pressure that must be managed. That pressure does not stay in the options market. It flows directly into futures through dealer hedging. The result is a shift in how markets behave.
Price does not just move because of buyers and sellers reacting to charts. It moves because large players are adjusting risk in real time.
Platforms like Quantower, combined with MenthorQ quantitative models and analytics, allow traders to see this layer directly on their charts. What used to be hidden inside the options chain becomes visible and actionable.
From Dealer Hedging to Price Movement
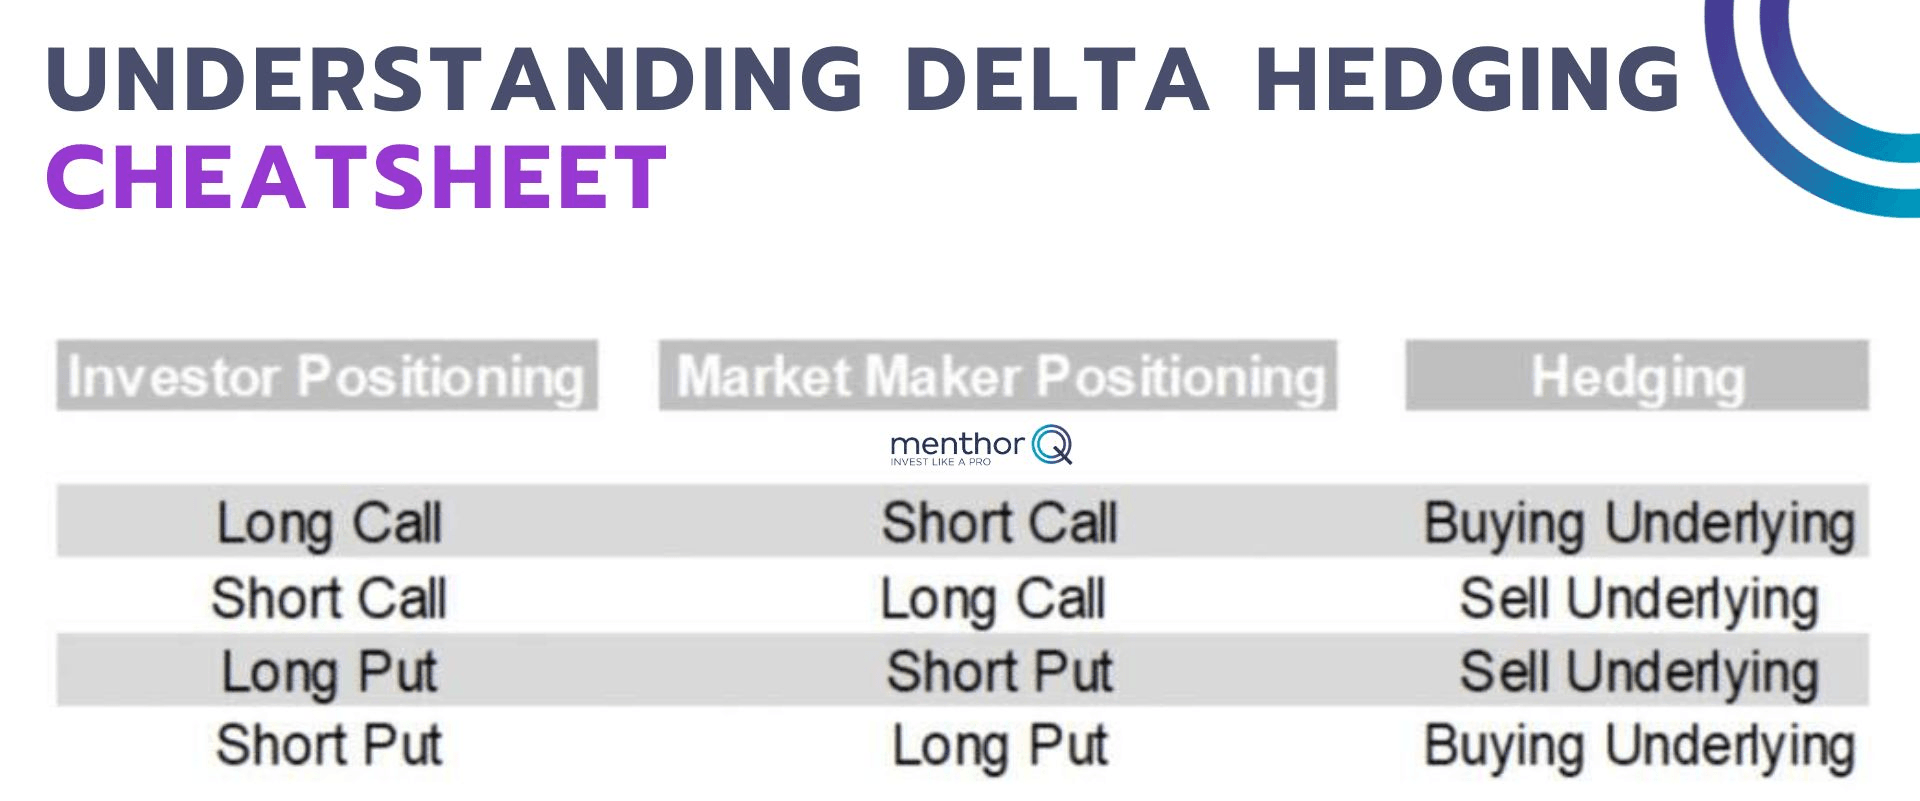
Market makers sit at the center of the options ecosystem. Their role is not to predict direction but to provide liquidity. To do that, they take the opposite side of client trades. That creates exposure and eventually market movement.
To manage this exposure, they hedge using the underlying asset, which in many cases means futures contracts:
- When markets rise, they may need to buy futures.
- When markets fall, they may need to sell futures.
This is not discretionary trading. It is mechanical and not dependent on market news.
The important part is that this hedging activity creates real flow. It can accelerate price, slow it down, or reverse it entirely, depending on where positioning is concentrated.
This is why markets sometimes move sharply without news or stall at levels that seem arbitrary on a standard chart. The explanation often lies in how dealers are hedging their options exposure.
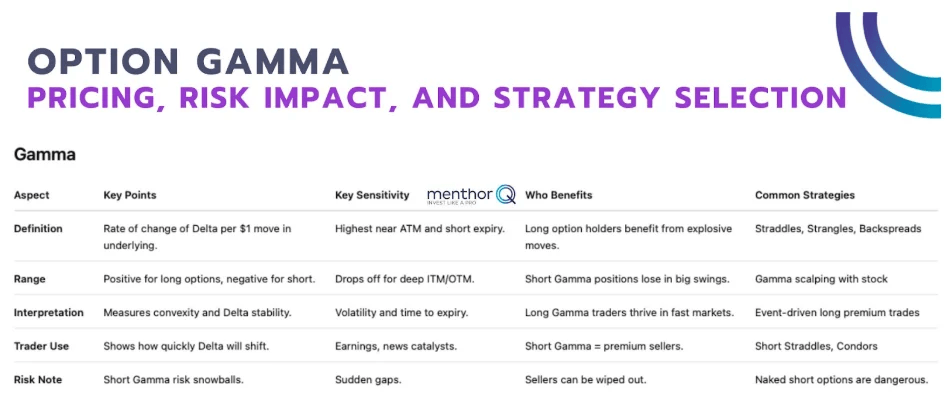
Gamma: The Engine Behind Dealer Behavior
Gamma is the variable that determines how aggressively dealers need to adjust their hedges. It measures how quickly their directional exposure changes as price moves. When gamma is high, even small price changes force dealers to rebalance more frequently.
Across the entire market, this sensitivity is aggregated into Gamma Exposure, or GEX. This metric shows how much futures flow could be triggered by a given price move. Where gamma is concentrated, hedging flows tend to be strongest.
This is why certain levels act like magnets, barriers, or acceleration points. It is not random behavior. It is the result of concentrated exposure forcing repeated adjustments.
How Hedging Shapes Market Behavior
To stay balanced, dealers continuously adjust their futures positions. This process is known as delta hedging. In high gamma environments, that balance is temporary. Every move in price shifts their exposure again, forcing another round of hedging. This creates a feedback loop.
In some cases, this loop suppresses volatility. In others, it amplifies it. When gamma is concentrated at a specific level, the hedging flow can act like a gravitational force. Price is repeatedly pulled back toward that zone, creating what traders often experience as “choppy” or range-bound conditions.
This phenomenon is often referred to as pinning. It is especially common near major strikes and around expiration periods.
Understanding whether the market is in a positive or negative gamma environment changes how a trader should approach setups.
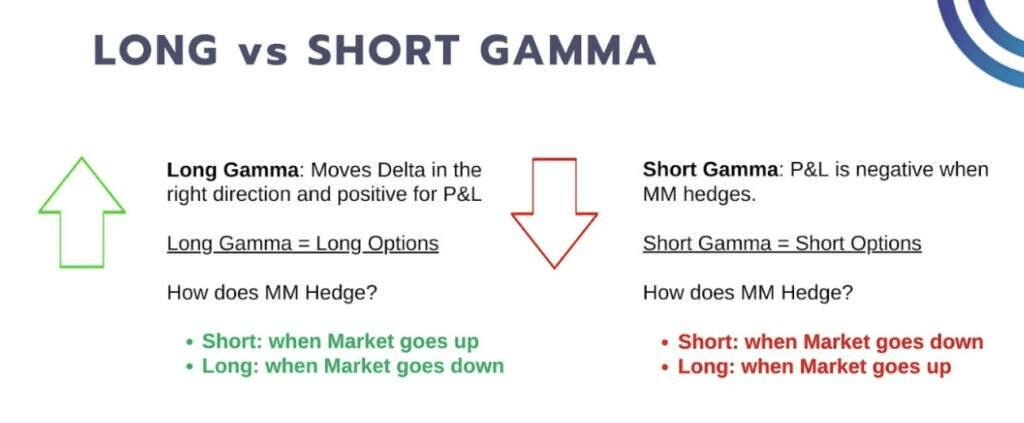
In a positive gamma regime, dealer hedging tends to stabilize price. Moves are faded, and the market often trades within ranges. Mean-reversion strategies tend to perform better here.
In a negative gamma regime, hedging flows reinforce price movement. Breakouts become more powerful, and volatility expands. Momentum-based strategies tend to work better in this environment.
The transition between these two states is one of the most important concepts in modern futures trading. It determines whether the market is likely to compress or expand.
Translating Option Data Into Price Levels
The biggest challenge with option data is not access. It is an interpretation. An option chain contains thousands of strikes and constantly shifting exposures. Without a framework, it is difficult to turn that information into something actionable. This is where MenthorQ’s models come in.
By analyzing the full options surface, they convert complex positioning into clear price levels that traders can use directly on their charts within Quantower.
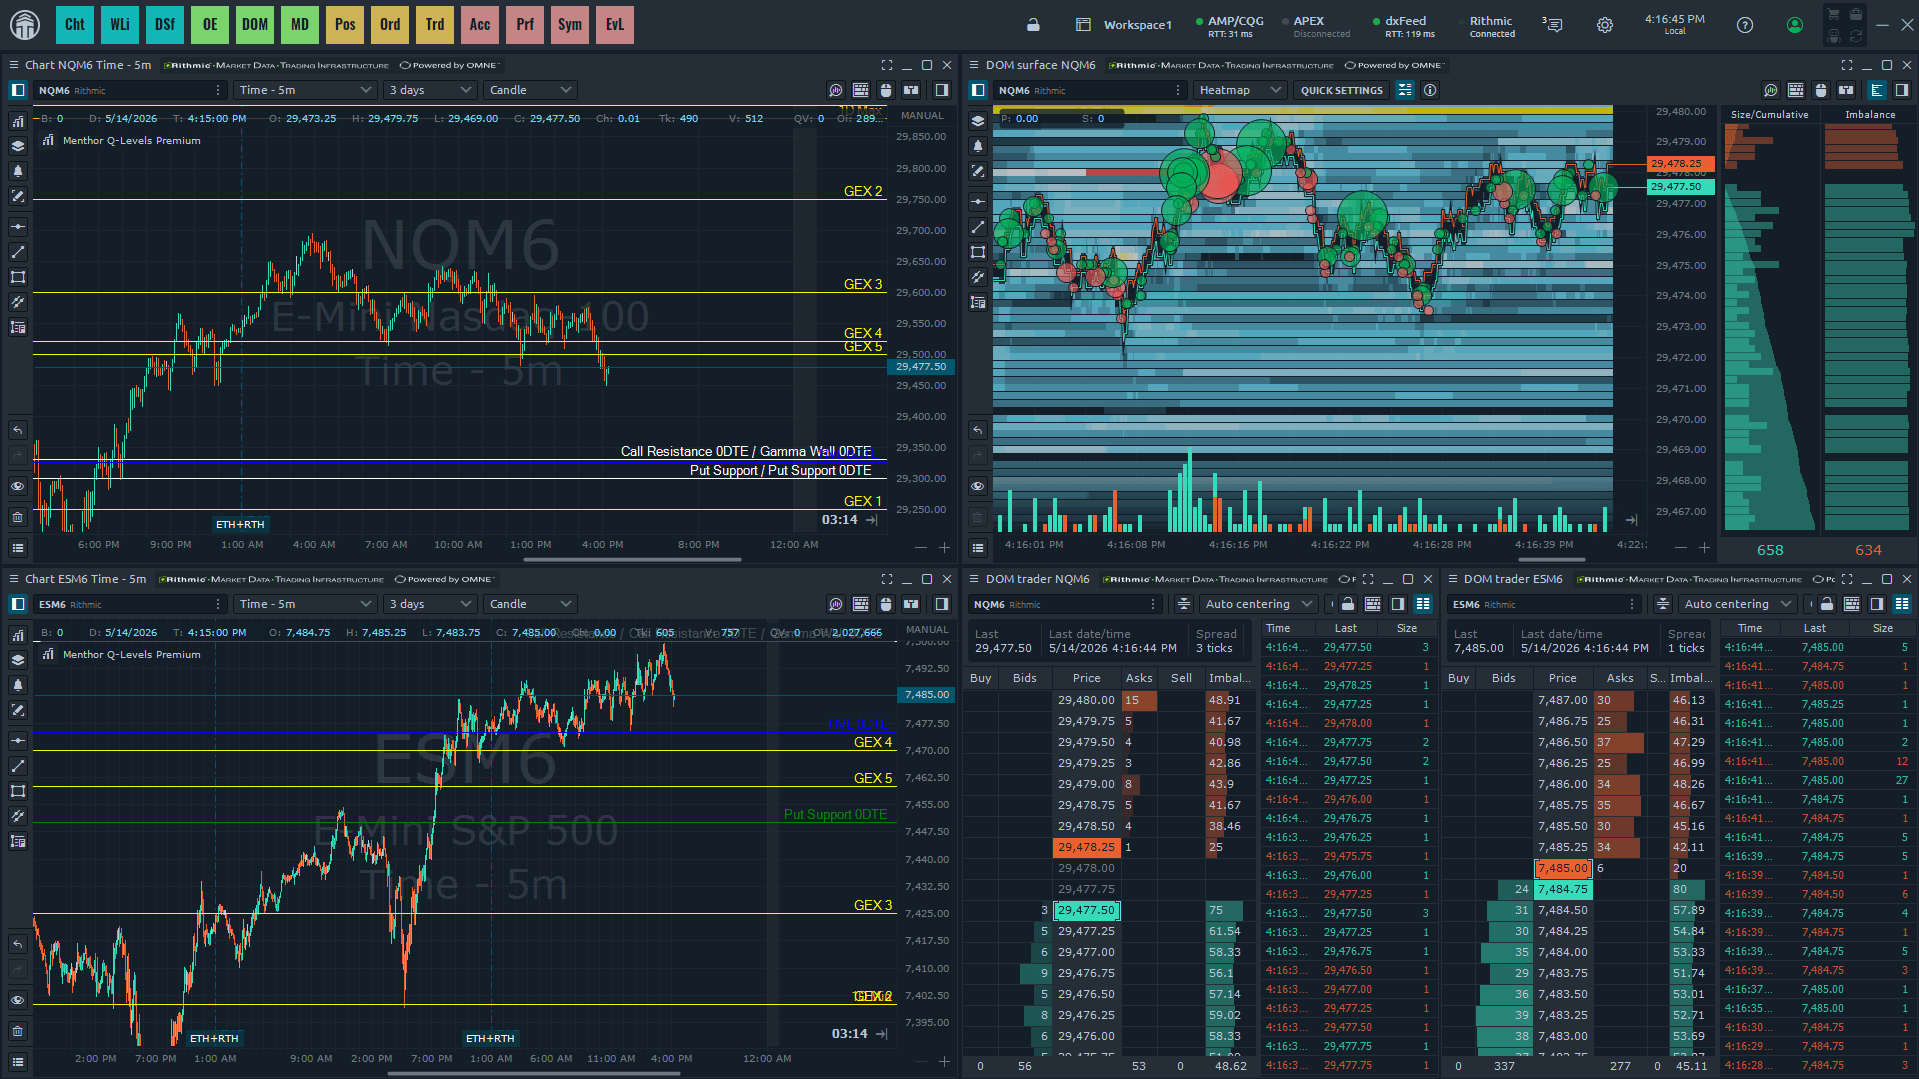
These include:
- Call Resistance, where upside pressure tends to build and price may stall
- Put Support, where downside hedging creates a cushion
- High Volatility Levels, which act as boundaries between stable and unstable conditions
These are not traditional technical levels. They are levels derived from live positioning and hedging dynamics. When price approaches these zones, behavior often changes because dealer activity changes.
The Growing Influence of 0DTE Flows
Short-dated options, especially 0DTE contracts, have become a major driver of intraday markets. These contracts carry extremely high gamma, which makes dealer hedging highly sensitive to even small price movements. This leads to very specific behaviors:
- Price is being pulled toward intraday levels
- Sharp rejections at key zones
- Rapid transitions from calm to directional moves
For futures traders, the opportunity is not in trading the options themselves, but in understanding where that pressure is concentrated to translate into directional trade execution.
When a 0DTE level appears on the chart, it highlights where hedging sensitivity is highest for that session.
Using GEX to Read Market Structure
Gamma Exposure provides a structural map of the market. It shows where dealer positioning is concentrated and how strong the associated hedging flows may be.
When GEX is positive, the market tends to remain stable.
When GEX is negative, the market becomes more reactive and directional.
The point where GEX shifts from positive to negative is often referred to as the High Volatility Level. This level acts as a dividing line between different volatility regimes.
Above it, the market is more likely to trade in ranges.
Below it, the market is more likely to trend and expand.
Mapping this level directly onto a chart provides a reference that traditional technical analysis cannot offer. It reflects live positioning rather than historical price reactions.
Why GEX Matters More Than Open Interest for Futures Traders
Many traders rely on open interest to understand positioning. The limitation is that open interest shows where positions were created, not how they are being managed in real time.
Dealer exposure changes continuously as price moves. These adjustments are not captured in static open interest data. GEX reflects this dynamic behavior. It shows how sensitive the market is to price changes at any given moment.
For intraday and short-term futures traders, this difference is critical.
Bringing Institutional Context Into Quantower
Quantower is known for its order flow and execution tools. By integrating MenthorQ analytics, it adds a new layer of context based on options positioning.
Traders can now overlay:
- Gamma Levels
- MenthorQ Blind Spot Levels
- Expected 1 Day Move
- 0DTE positioning
These levels update automatically and align with tools such as footprint charts, volume analysis, and liquidity tracking. This combination allows traders to connect price action with the underlying forces driving it. Instead of reacting to movement, they can anticipate where reactions are more likely to occur.
Conclusion
Futures markets are increasingly shaped by options activity. Liquidity, volatility, and price reactions are no longer driven solely by directional trading. They are influenced by how positions are structured and how risk is managed. Understanding this dynamic gives traders an advantage.
By combining MenthorQ’s option analytics with Quantower’s execution and order flow tools, traders gain access to a more complete view of the market. This approach shifts trading from reactive to informed.
Instead of relying only on charts, traders can incorporate positioning, flow, and market mechanics into their decision-making. That is where modern futures trading is heading.


Comments