Kagi, Point & Figure, Historical Symbols, Text drawings are available in Quantower
Navigation
A growing number of new customers and fans give us valuable feedback and ideas that we are striving to add to Quantower. Today we are pleased to present you with new features, chart types, drawings, as well as a number of important improvements.
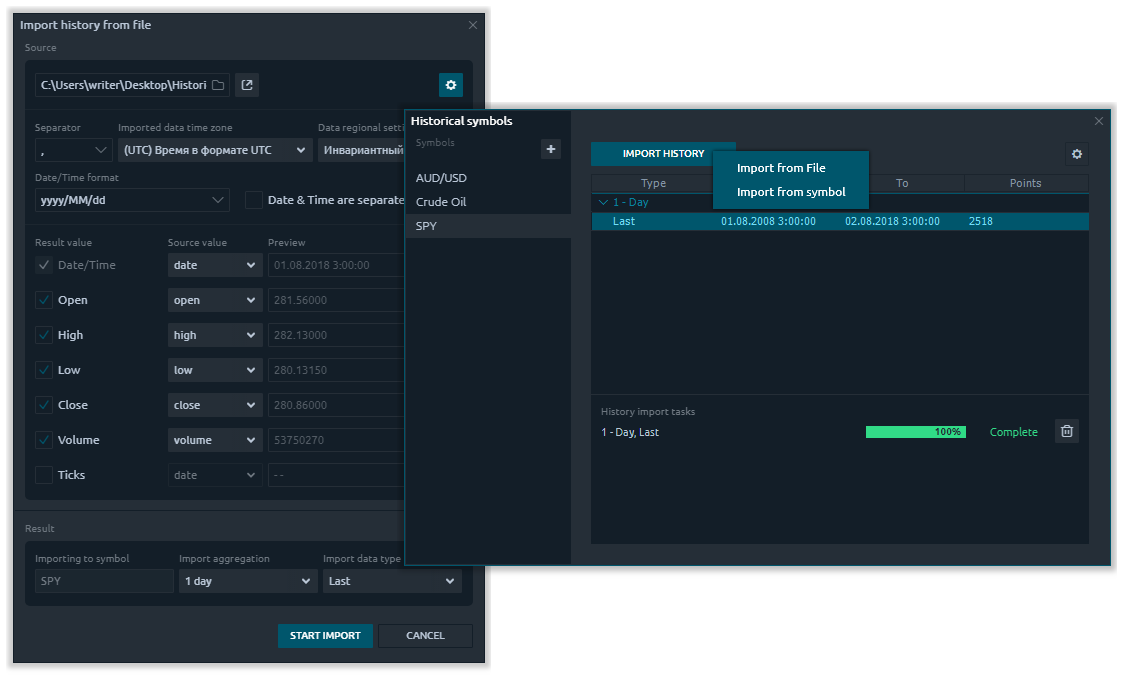
Historical Symbols
If you need to import trading quotes to Quantower from a third-party data provider for performing a backtesting or technical analysis, Historical Symbols will be indispensable in this case. For example, you can download any price data from Quandl, IQFeed, NASDAQ or Yahoo and test your trading idea on them.
Increased performance
Each release includes a lot of new functionality, but we never forget about improving and optimization of our platform. In this release, we were able to reduce the amount of RAM required for work to approximately 40%. In addition, most of the panels will now be open in a few times faster.
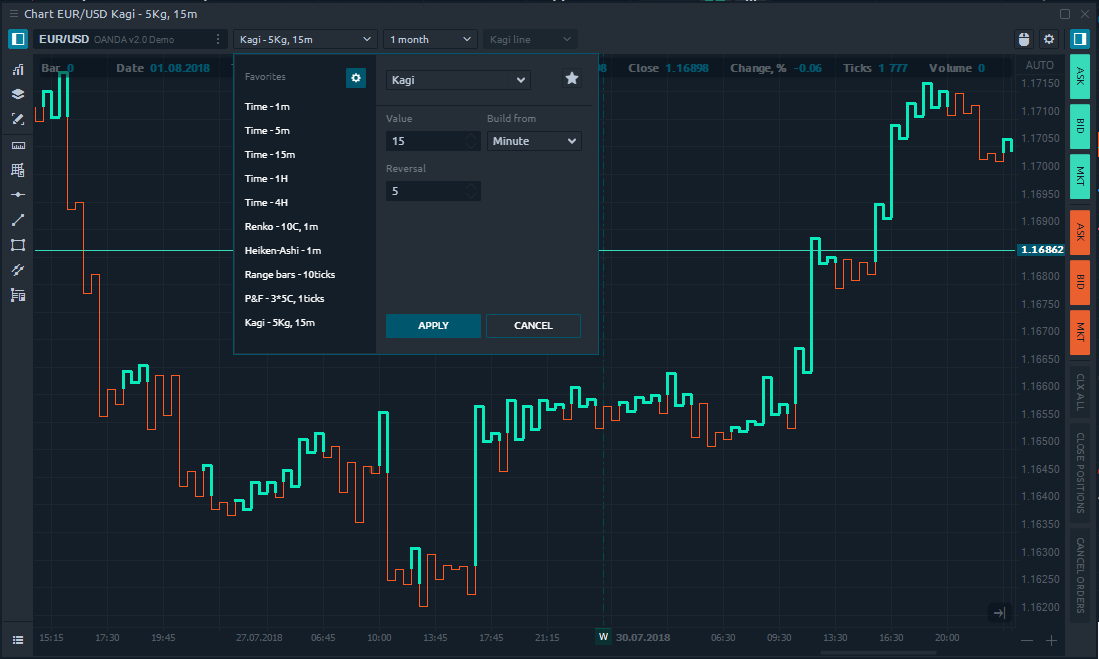
Added Kagi chart type
In this release, we’ve added Kagi chart, which is completely time-independent, based on price only and help filter out the noise that can occur on other chart types. The uniqueness of constructing Kagi is to draw a continuous line that changes to green or red if the price increases or falls respectively.
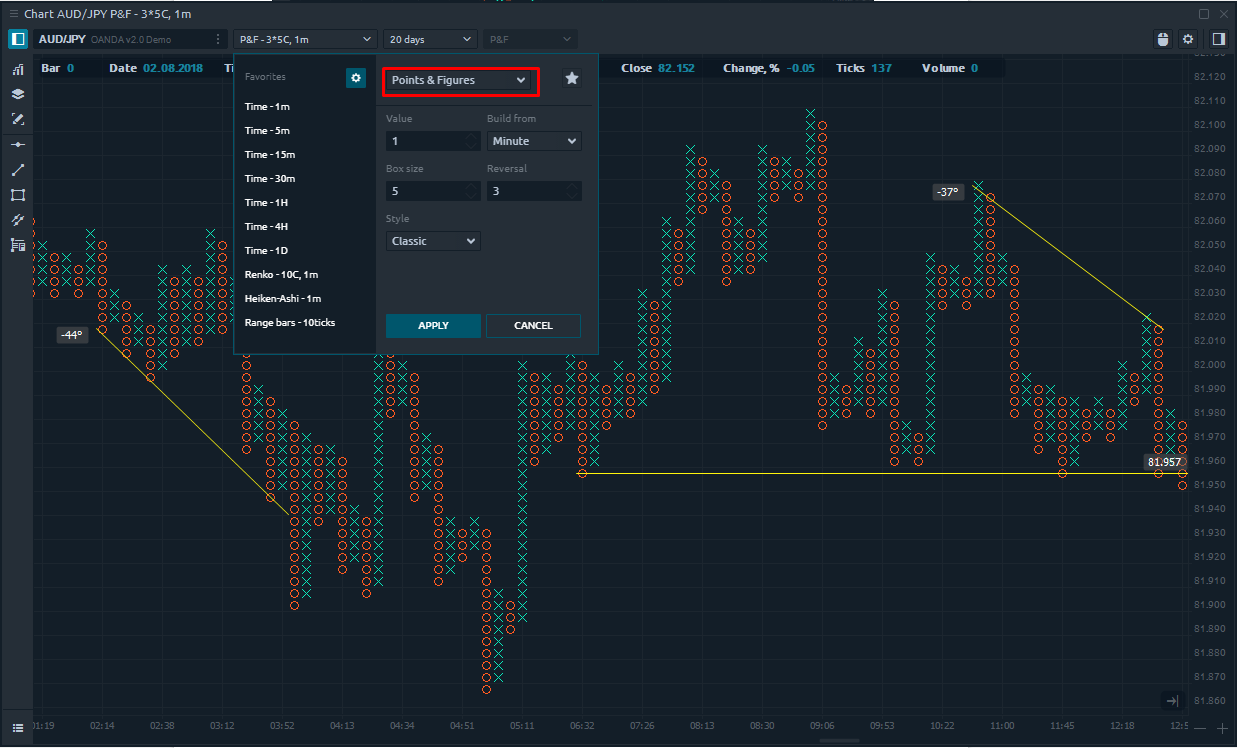
Point & Figure chart is ready
Point & Figure is one of the most popular chart types that allows traders to analyze only the price without time-bound, thereby eliminating market noise.
The lack of a time constraint gives point and figure charts the advantage of being able to reveal the nature of share price movements over extended time periods. It is generally used to identify periods of consolidation, as well as set price objectives based on chart formations.
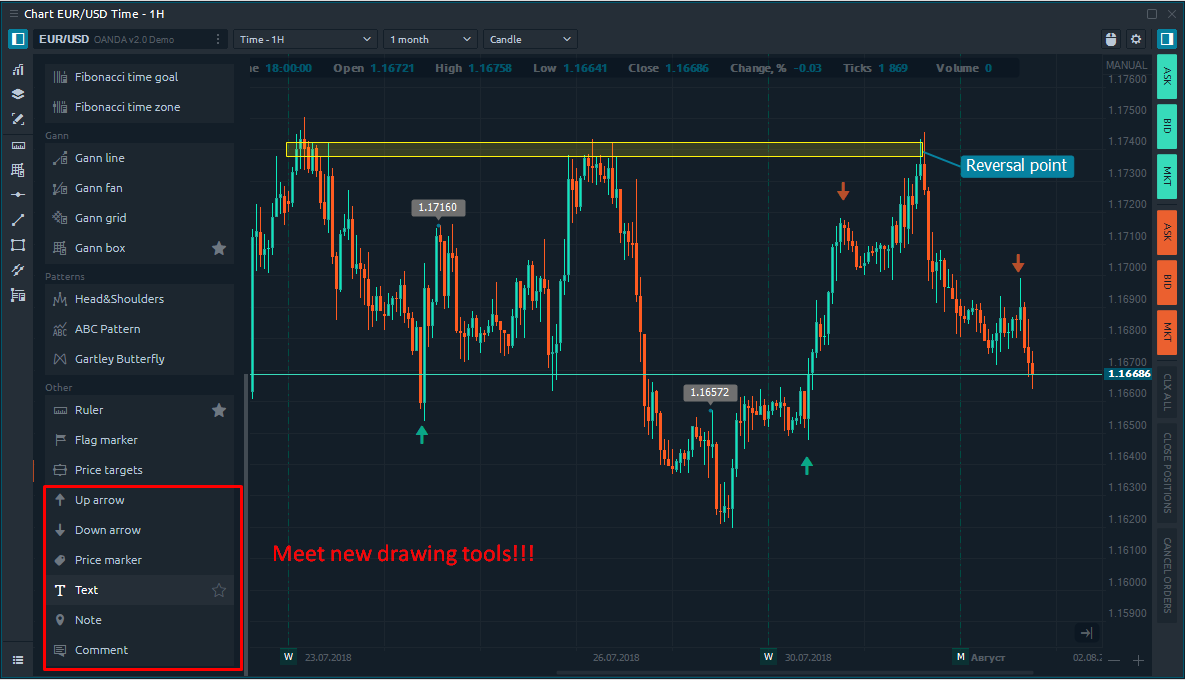
More drawing tools - Arrows, Text, Comments, Price marker
To the existing list of drawing tools, we’ve added:
- Up & Down Arrows. Mark important places for you on the chart
- Note. Just create a new note and add your thoughts. When you hover over the created marker, the written text will be displayed
- Text. Write all necessary notes directly on the chart
- Comment. Add your thoughts directly on the chart and share with your friends.
- Price marker. This tool allows you to place price labels directly on the chart
UI/UX update
Constantly reviewing our application, we always find opportunities for small but pleasant external changes that will make it clearer, but beautiful at the same time.
In this release, we’ve updated the view of Chart trading mode, making it more compact. Also, we added buttons to close current positions and cancel placed orders. Be sure to write your feedback about this change.
Conclusion
The full changelog is quite lengthy and mostly consists of minor bugfixes. What are your thoughts on the new features? Let us know if we missed something important you were expecting to see or throw us some ideas for future releases!
P.S. We invite everyone to participate in the discussion of the new features for crypto connections in our focus group in Telegram channel


Comments