Massive Update! Connection to MetaStock Data Feed, Forward Curve panel, Bracket Orders and Alerts Log panel
Navigation
Added connection to the MetaStock data feed
MetaStock provides the most comprehensive market information, news, analytics, and fundamentals available in a desktop. Day Traders will appreciate the real-time data and news in MetaStock Real Time and MetaStock XENITH which are powered by Refinitiv (Thomson Reuters). All of the products include global market data for analyzing stocks, options, commodities, indexes, foreign currency and more.
One of the MetaStock's key feature is providing safety to its data, so the process of registration and getting connected may require some special attention. That’s why we’ve prepared a connection guide.
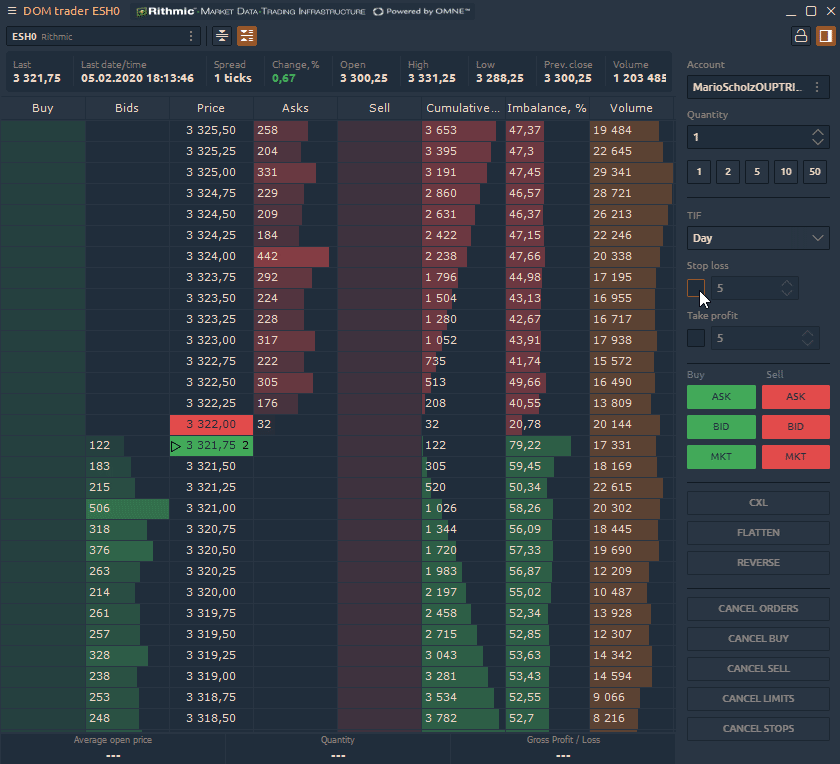
Bracket orders available with Rithmic connection
Bracket orders allow you to set Take Profit and Stop Loss orders for existed Limit Order. Before placing a new order, specify an offset in ticks for opposite closing orders.
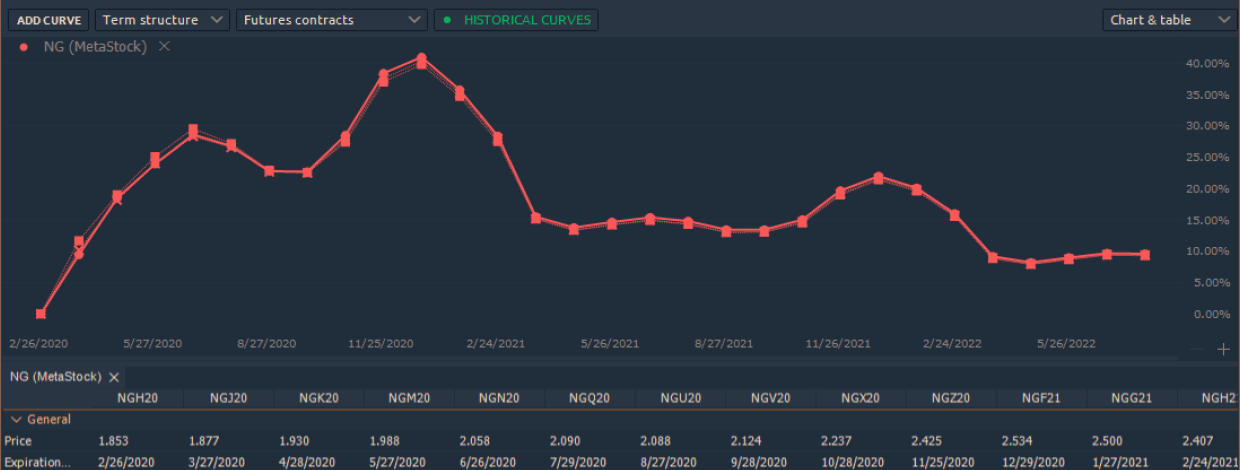
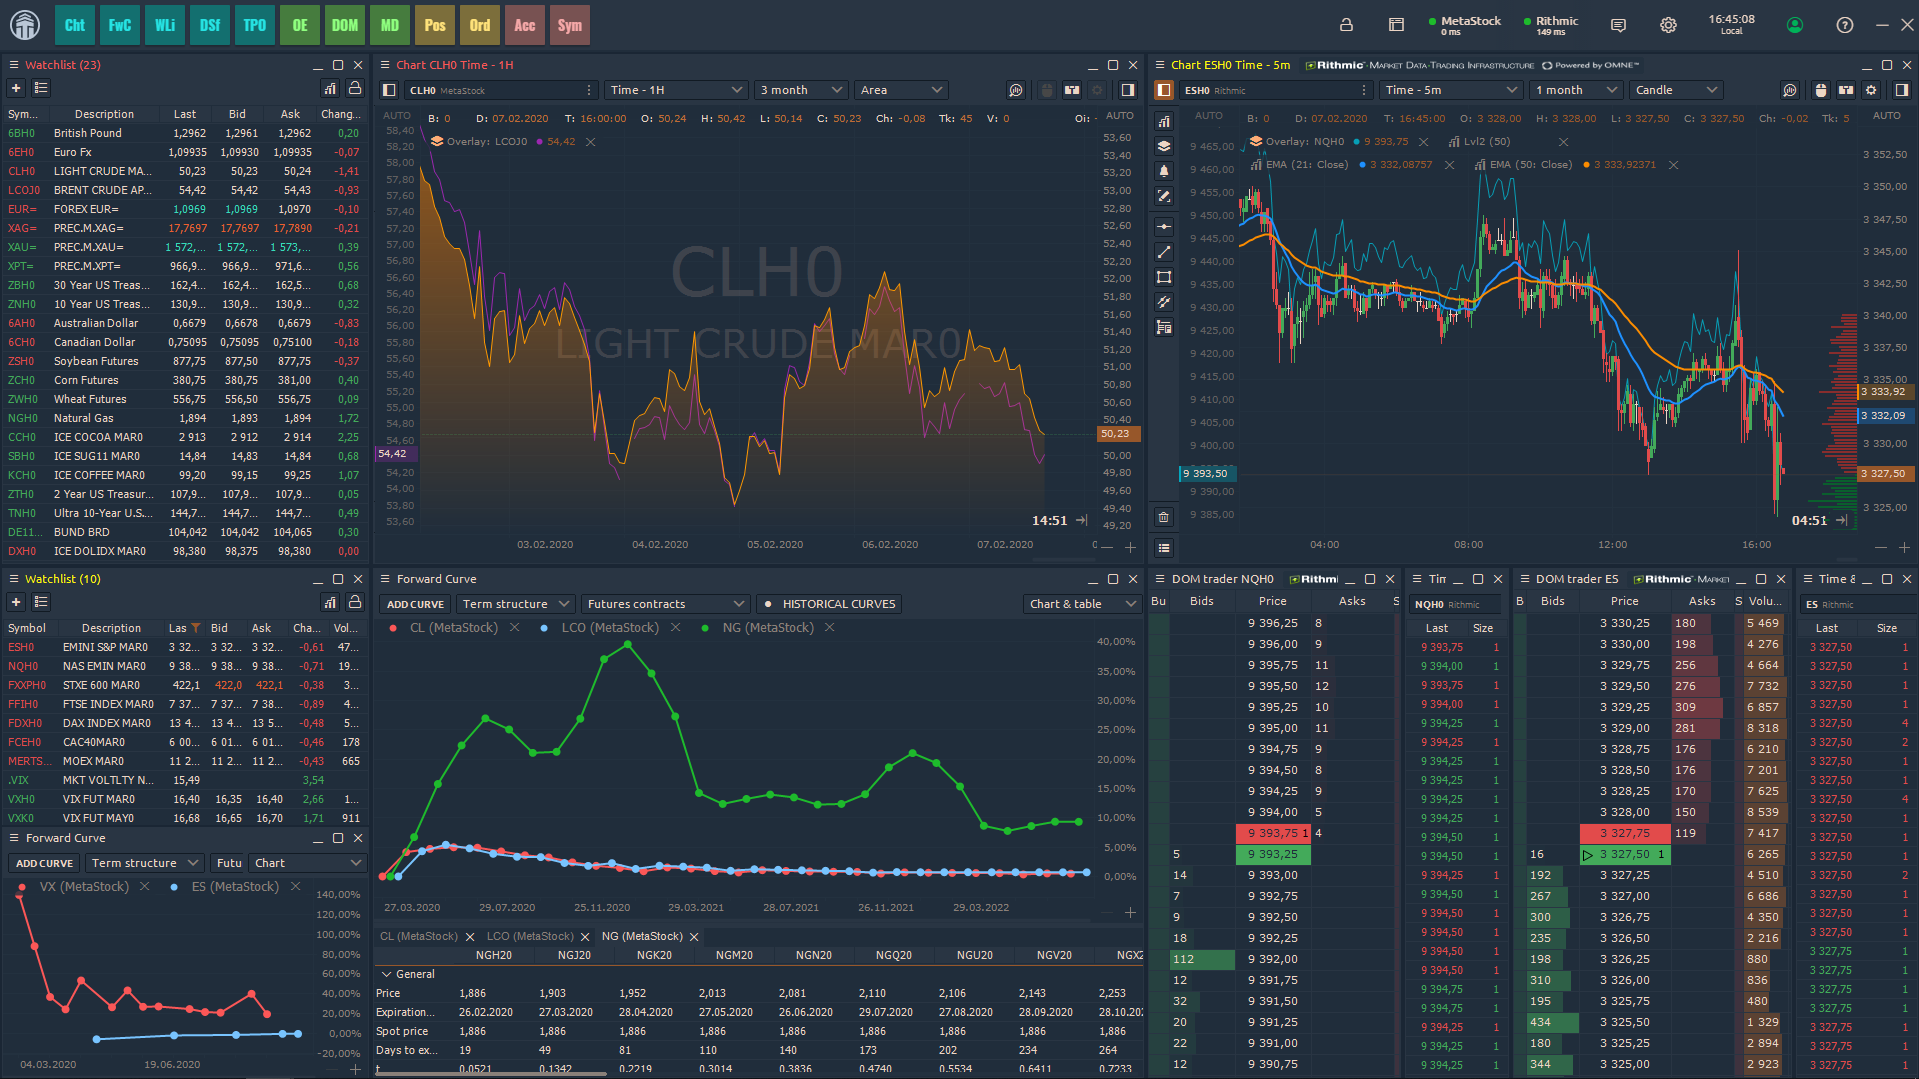
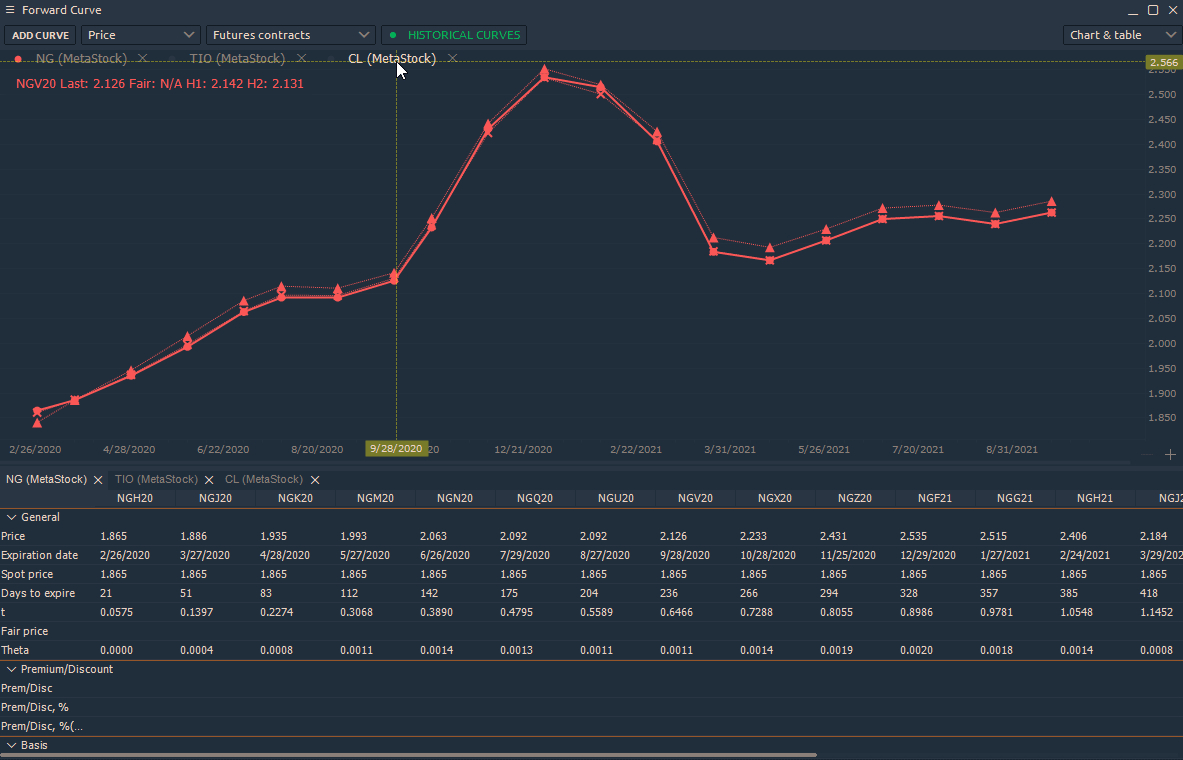
Forward Curve Panel
Forward Curve (or Futures Curve) is the plotting of the current price for each futures contracts on commodity, swap or interest rate, at a certain date in the future. While it is a key indicator of today’s market sentiment, the forward curve is not a price forecast – it is a set of today’s prices for dates ahead.
After launching the panel, add the analyzed instrument and you can see prices for all forward contracts on a single curve. By changing to the Term Structure, you will see the ratio of all contracts to the current.
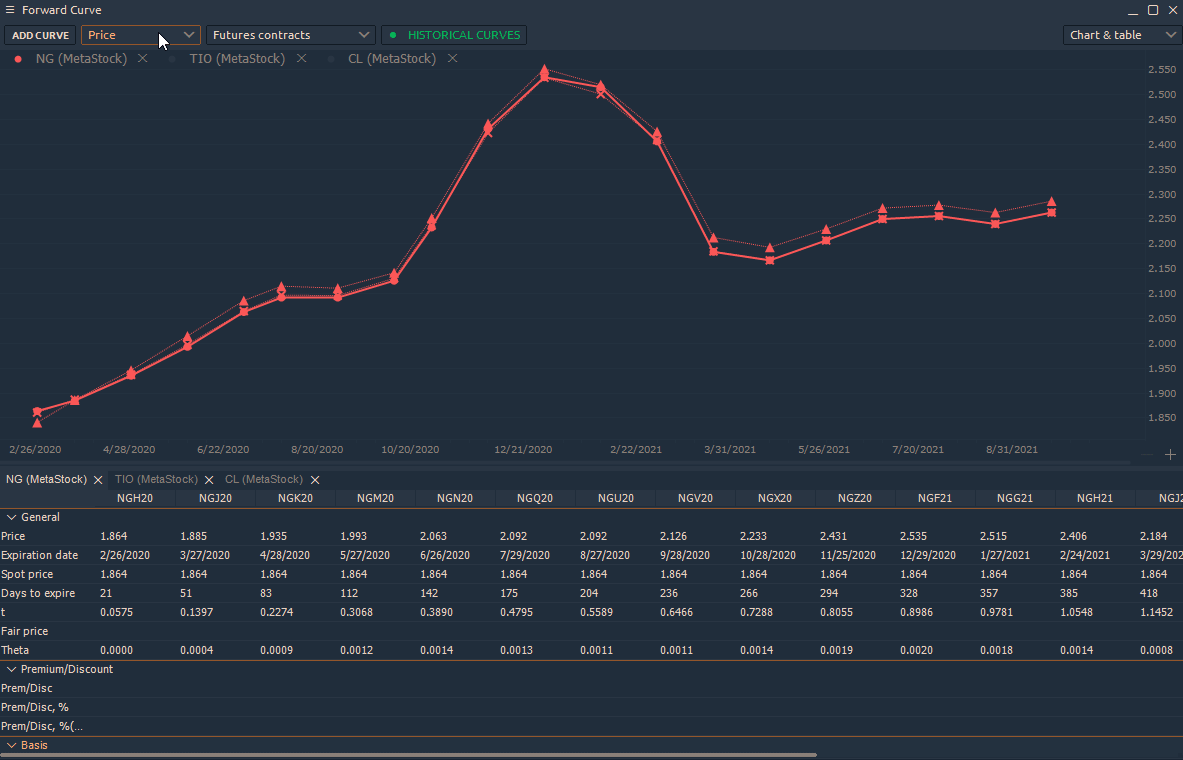
Additionally, you can add different assets to one chart and compare them with each other.
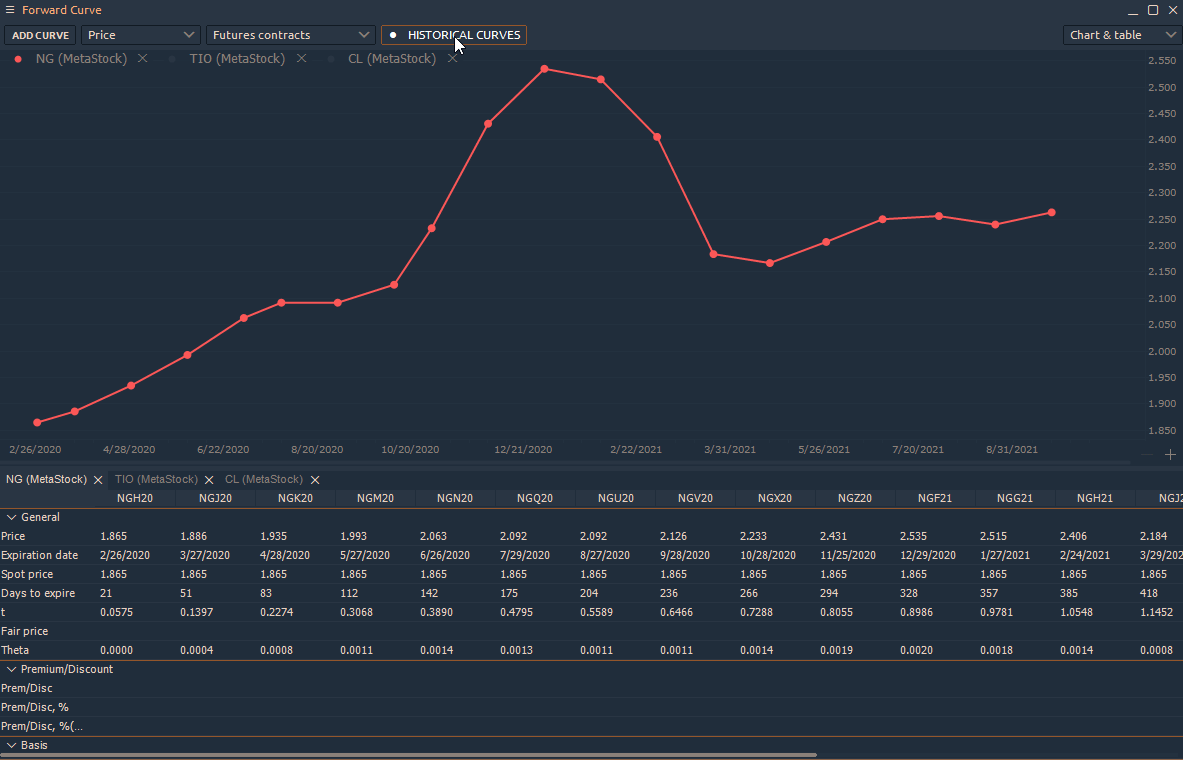
Using the Historical Curves mode, you can compare several lines at the same time for different dates and estimate the change of the curve in time.
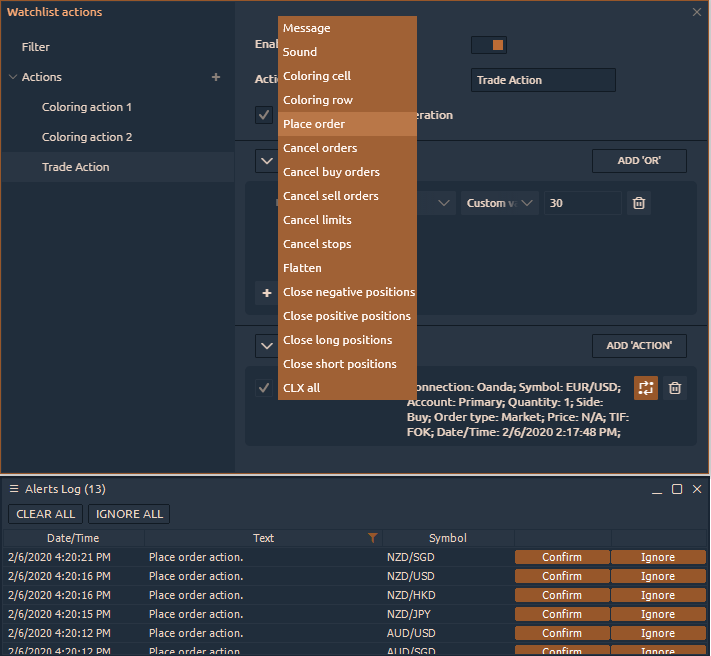
New panel Alerts Log. Trading actions with Alerts Log
Now, all alerts that you set in different panels — Chart, Watchlist, Time & Sales — will come to the Alerts Log panel. For example, set an alert on all instruments in the watchlist with the condition that the last price will cross the RSI indicator's value. As an action set the Coloring Row with Message of this action. As soon as the condition is met, a new alert will appear in the Alerts Log panel will automatically open this panel.
If you have closed this panel, you can find it in the main menu in the category Informational panels — Alerts Log (AlrL).
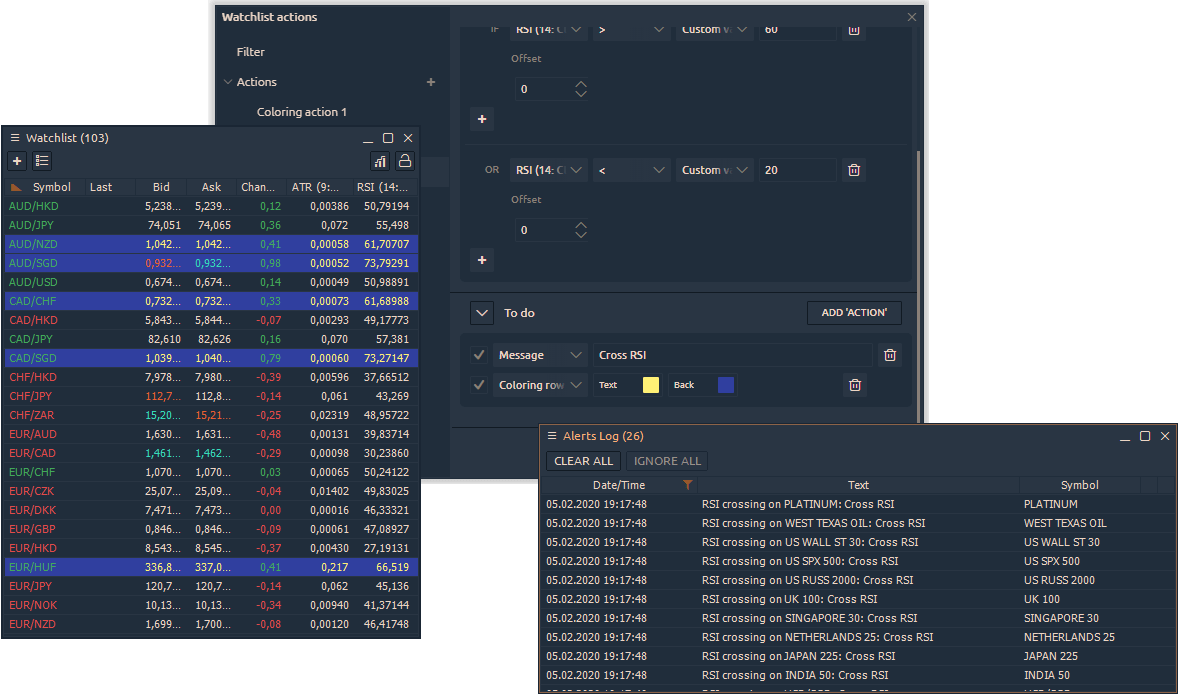
You can set trading actions on any alert — Place an order, Cancel order or Close position.
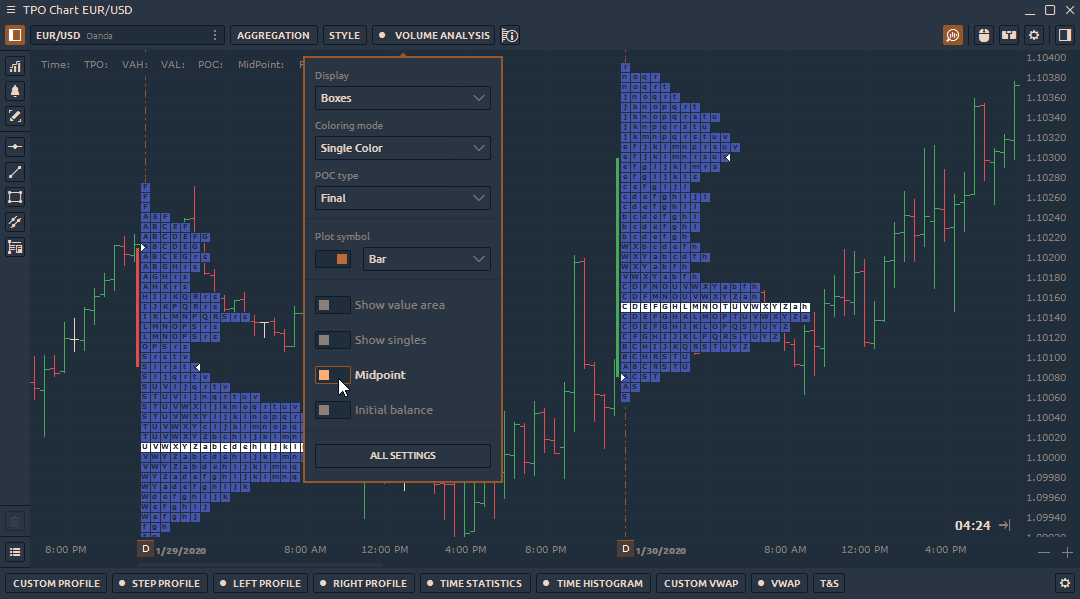
Added Midpoint to Market Profile
Midpoint shows the middle line of the Market profile. It is more often used as a support/resistance line or a balanced line for D-shape profiles.
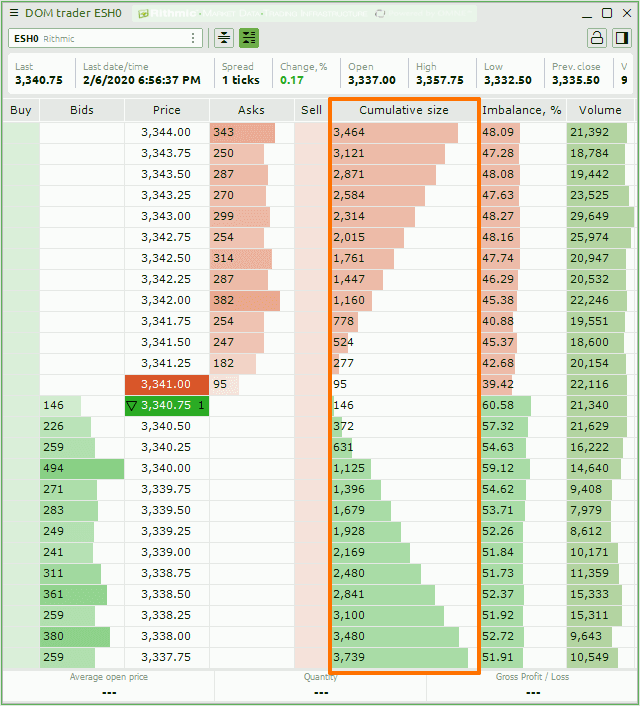
Cumulative size in the DOM Trader panel
The new column in the DOM Trader panel, called Cumulative Size, shows the sum of liquidity at each price level.
English


Trade with Quantower
Download the latest stable version of Quantower application for Windows for free and without registration
Comments