Quantower improved DOM Trader and added multiple templates for drawings
Navigation
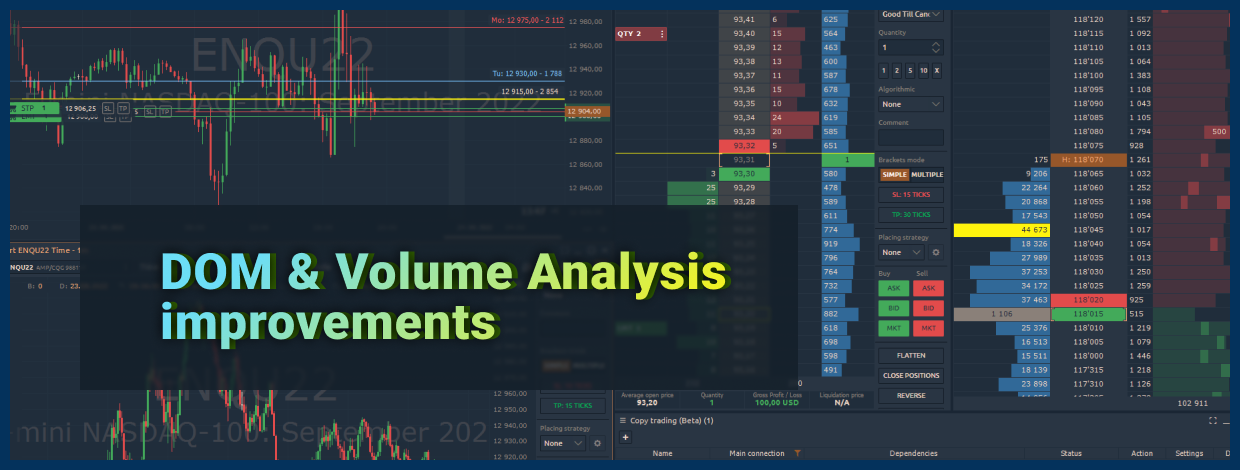
We could start with some abstract introduction, but the recent release is so exciting that we'll get right to the point. Meet the new version of Quantower with improvements in DOM Trader panel, multiple templates for drawings & indicators, copy trading for CQG connection and many other updates.
Single Buy/Sell column in DOM Trader panel
Finally, our team has added the most demanded feature to the DOM trader panel - Buy/Sell single column for placing and managing orders and positions. By activating this mode, traders can further optimize the workspace, and as a result, use more DOM panels at the same time.
Recall that by default, limit orders are placed on the left mouse click, and they are canceled on the right click. If you need to set a Stop order, then simultaneously with the mouse click, hold down the Shift key.
Create Multiple Templates for Drawings and Indicators
Starting from Quantower version # 1.126 all drawings and indicators have a new option 'Save as Template'. Using multiple templates, a trader can set up drawings or indicators with different visual parameters, and switch between them in a couple of clicks.
Once you have configured the drawing or indicator to your own choice, click on the Save icon and select Save as Template from the dropdown list. After you set the desired name for it, you can create another template and switch between them via the context menu.
Multiple Standard Deviation (STD) lines of VWAP
In the new version of the platform, we added the ability to display several standard deviation lines using a multiplier. In the VWAP settings, specify the size of the STD, as well as the number of these levels.
In addition, you can enable two or more identical VWAPs, but each of them has a different STD parameter (for example, STD 2, STD 1).
Moreover, we’ve added a new setting on the Price scale that will Fit VWAP lines to the visible chart area.
New drawings — POC Line, Weekly POC Line
Two new drawing tools are an evolution of the Volume Analysis functionality, which display Point of Cotrol (POC) levels.
POC Lines tool shows the level of maximum volume for the selected time interval, such as the current trading day, hour or custom range. Besides, in the tool settings, you can choose the data type (Volume, Trades, etc.), on the basis of which the POC level will be shown.
Another useful addition is the optional display of the Secondary POC, which shows the second largest volume for the selected time range. Adjusting two parameters - Deviation from POC in Ticks and in Percent - you can regulate the minimal and maximal distance from the main POC.
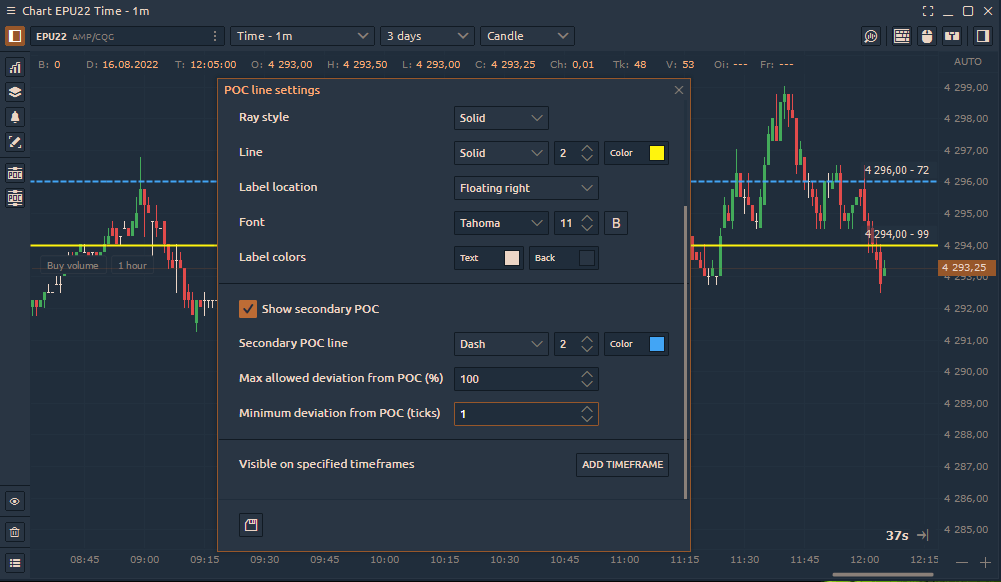
For example, if in the ES futures the first and the second POC are 15-20 ticks apart, then they can be considered as two separate and important support/resistance levels. But if the two levels are 1-2 ticks apart, it would be one important price reaction zone.
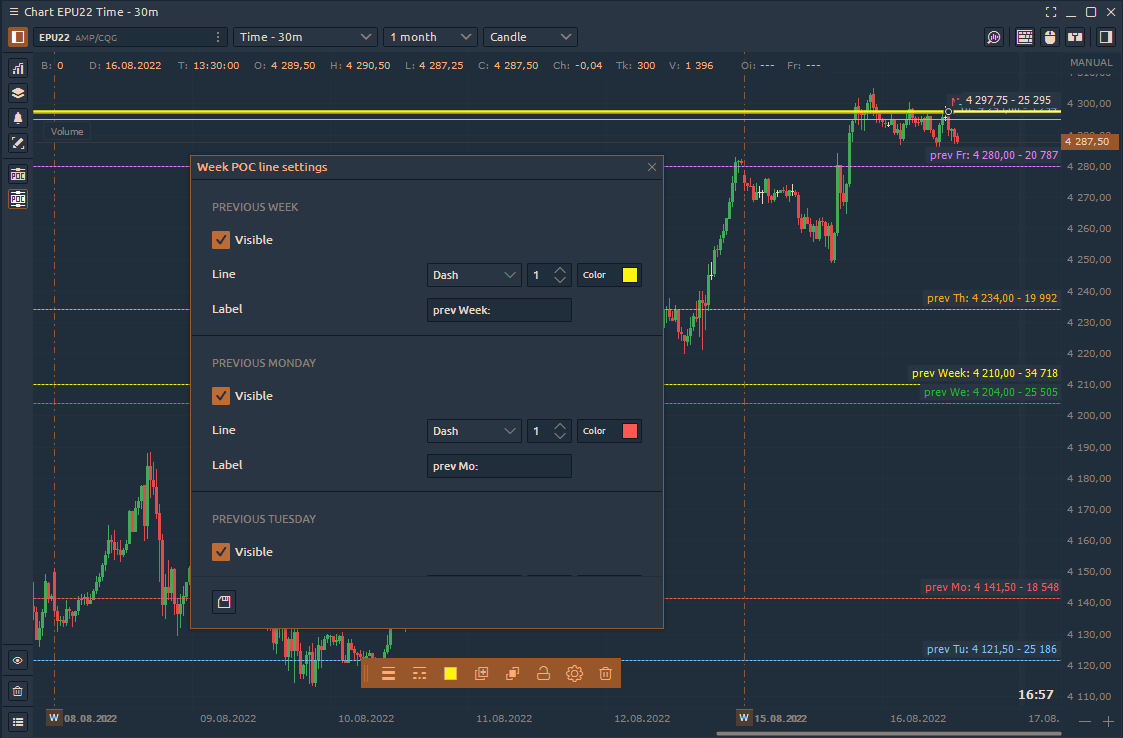
Week POC Lines tool shows the daily and weekly maximum volume levels (Point of Control). In the tool settings, you can choose the days to display on the chart - Сurrent or Previous.
English


Trade with Quantower
Download the latest stable version of Quantower application for Windows for free and without registration
Comments