Volume Profile Trading: Advanced Setups and Order Flow Confirmation
Navigation
A Volume Profile level is a location, not a trade.
The setup comes from context: where the session opens relative to the previous day’s value, whether the market is balanced or moving away from balance, and how price behaves when it reaches a planned reference.
This guide builds on the basics covered in Volume Profile: How to Read It. Here we focus on practical Volume Profile trading: previous-day and developing levels, TPO, order flow, VWAP, and the conditions that cancel a setup.
Market Context: Balance vs Imbalance
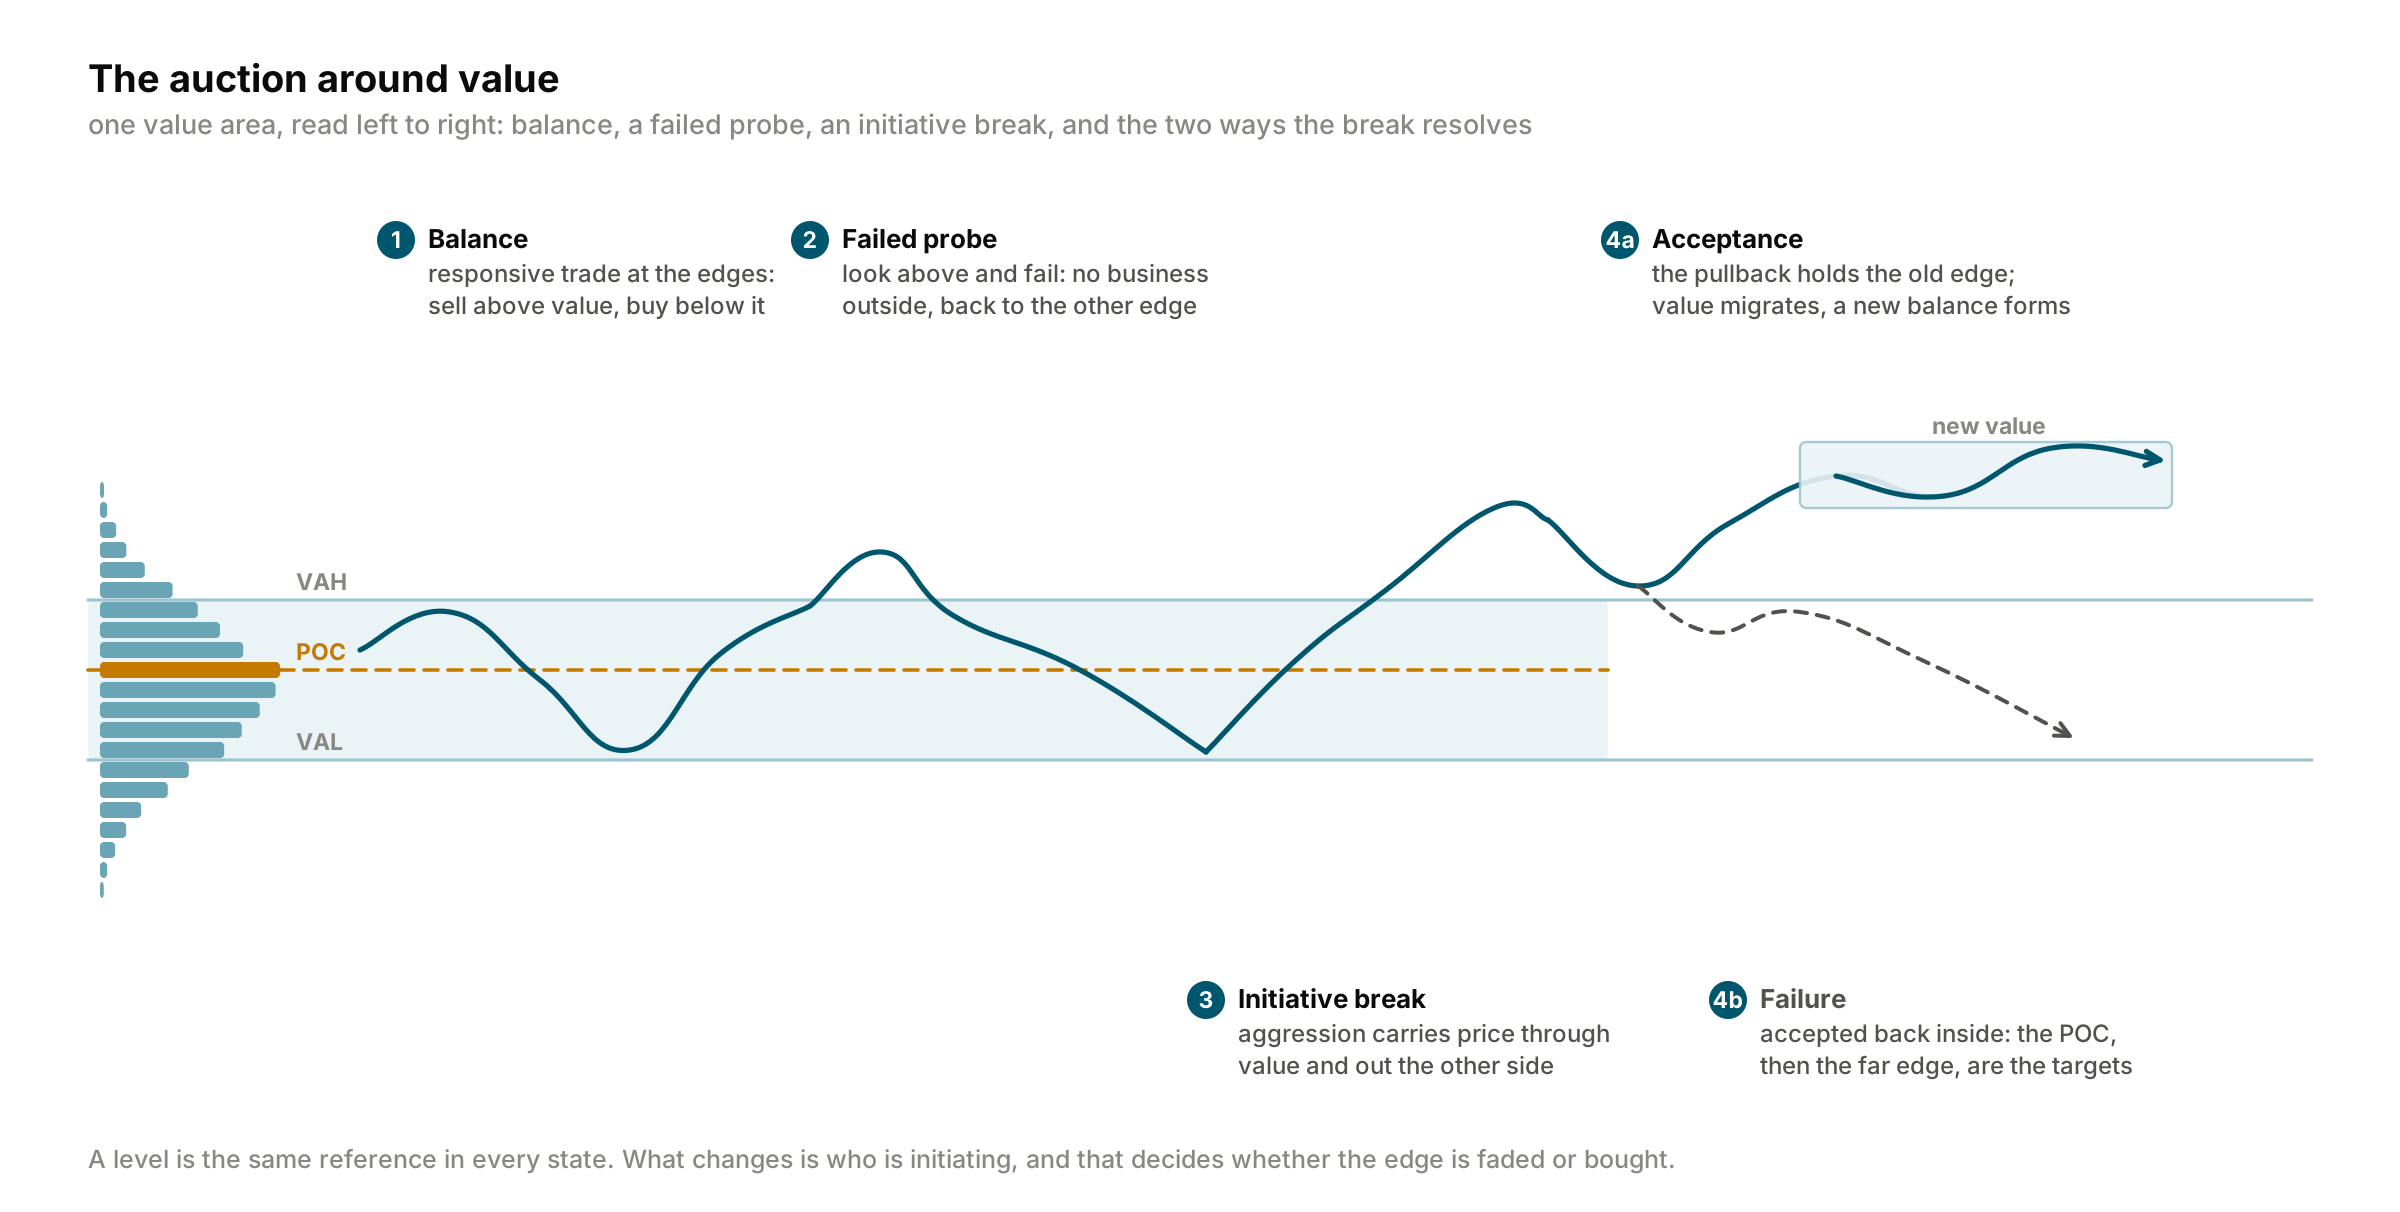
The same edge of value can reject price one day and give way the next. Context explains the difference. In balance, sellers act above value, and buyers below it, and price rotates back toward the POC. In a trend, buyers keep lifting offers above value (or sellers keep hitting bids below it), and value migrates with the price.
Start the day with one question: where did the session open relative to the PD profile?
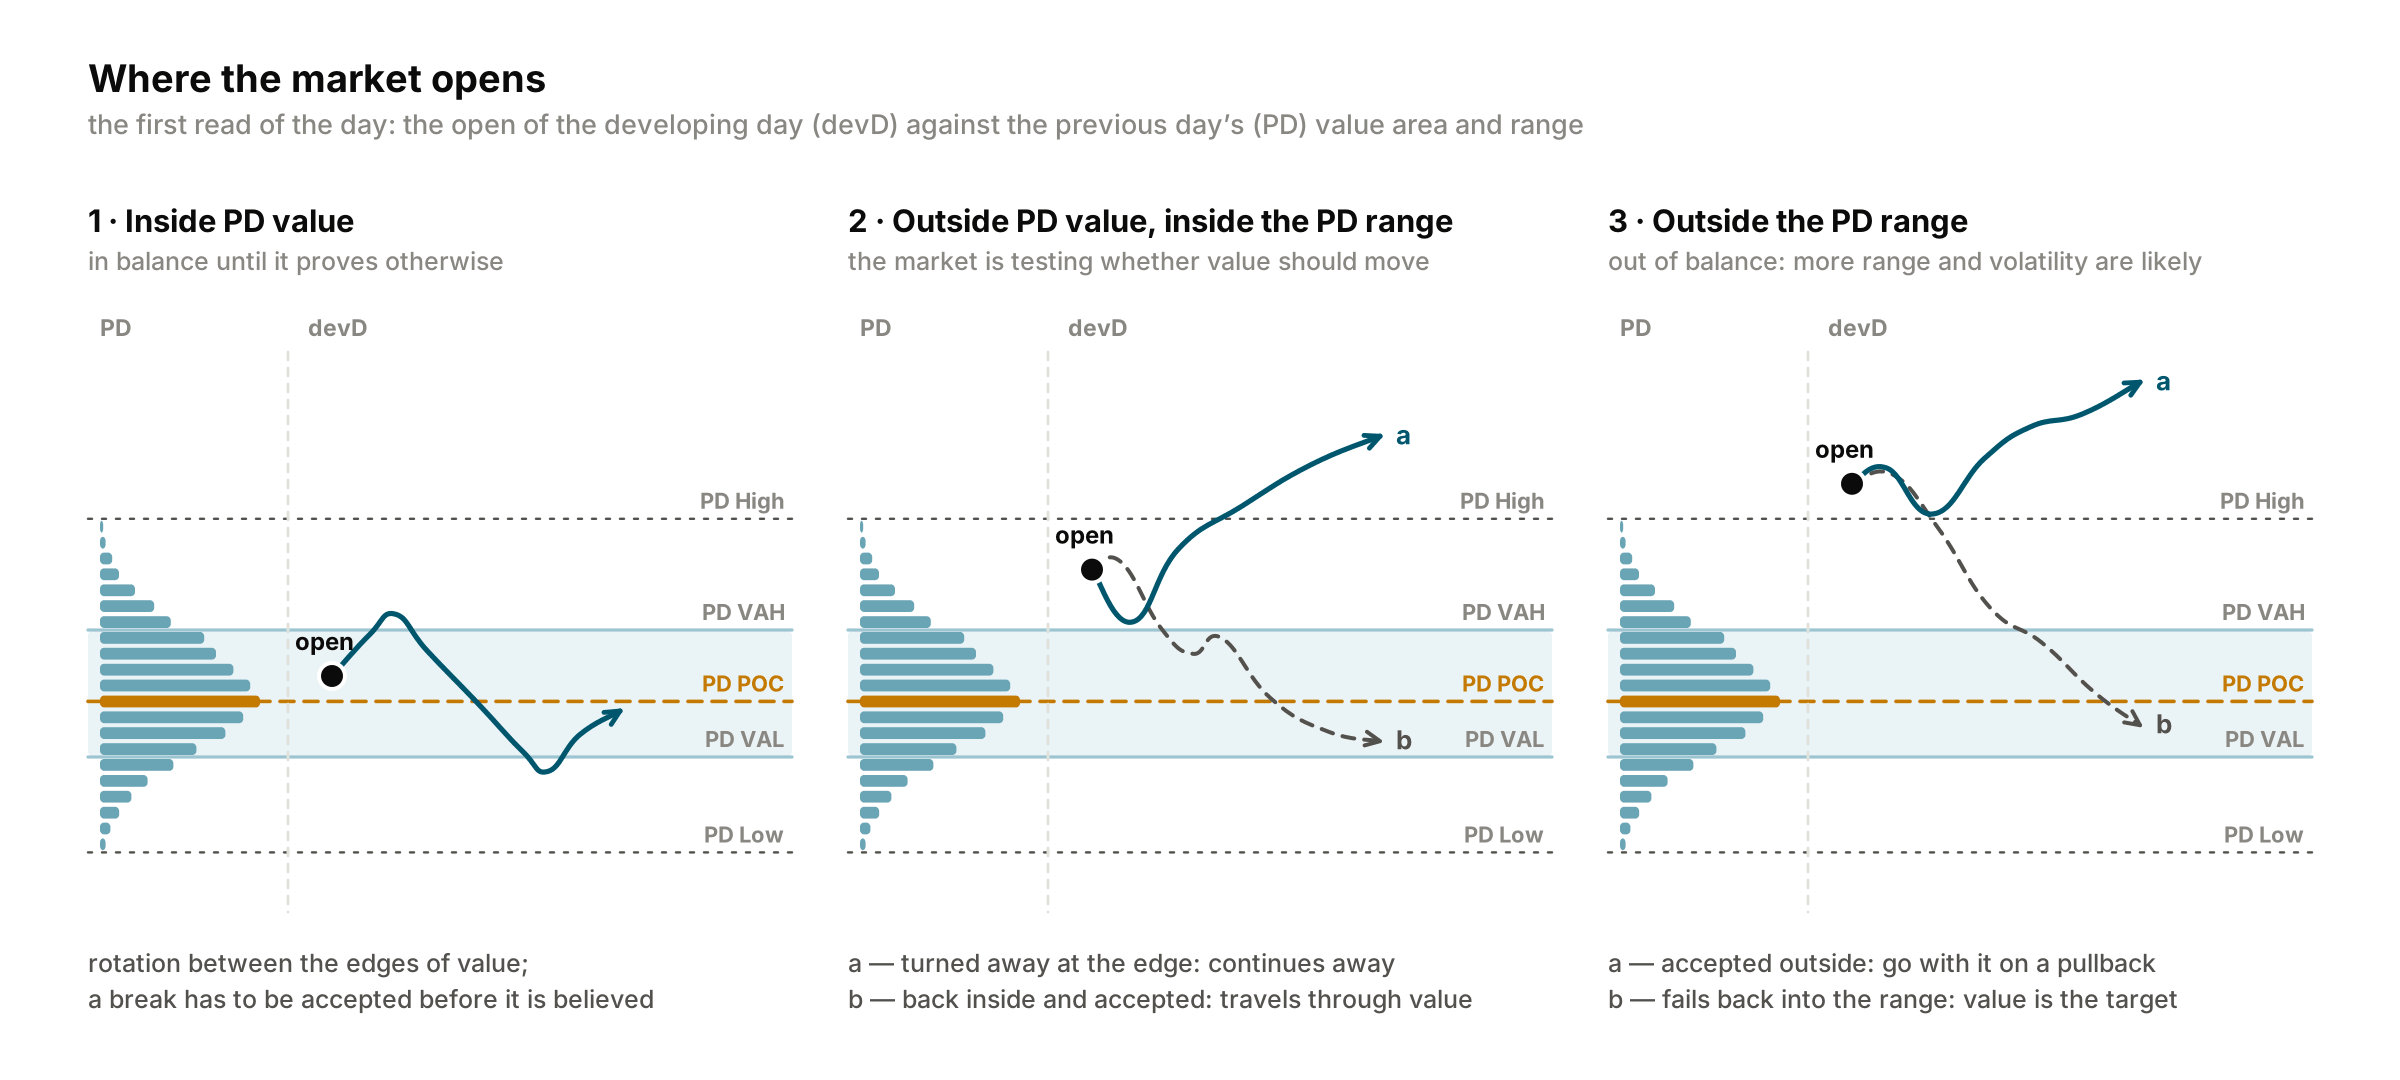
Inside PD value: expect balance. Fade the edges and target the PD POC. Outside value but inside the PD range: a test. Either the edge is rejected and price moves away, or price is accepted back inside and rotates through value to the opposite edge. Outside the PD range: imbalance. If the move is accepted, trade the pullback in its direction; if it fails, target PD value. An open that drives in one direction without a pullback (an open-drive) signals other-timeframe participation; do not fade it without evidence.
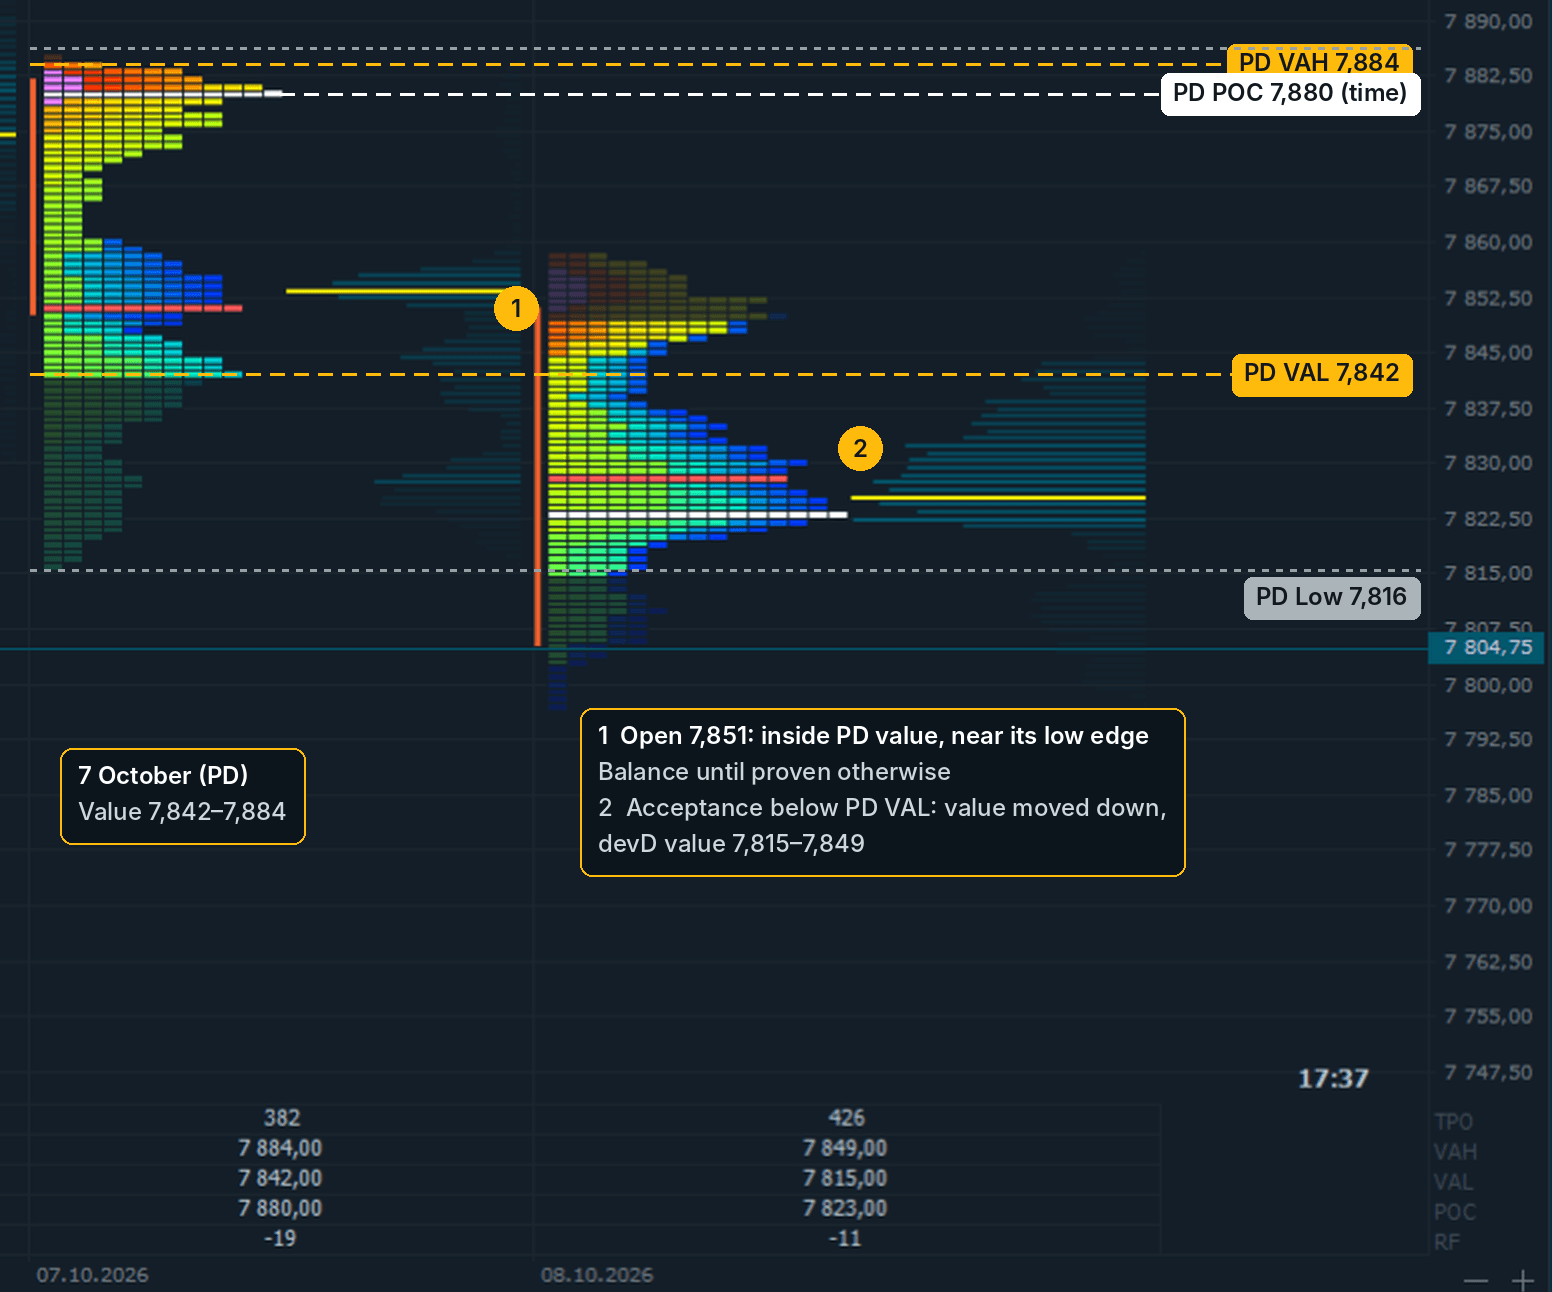
Previous Day VP vs Developing Volume Profile (VP)
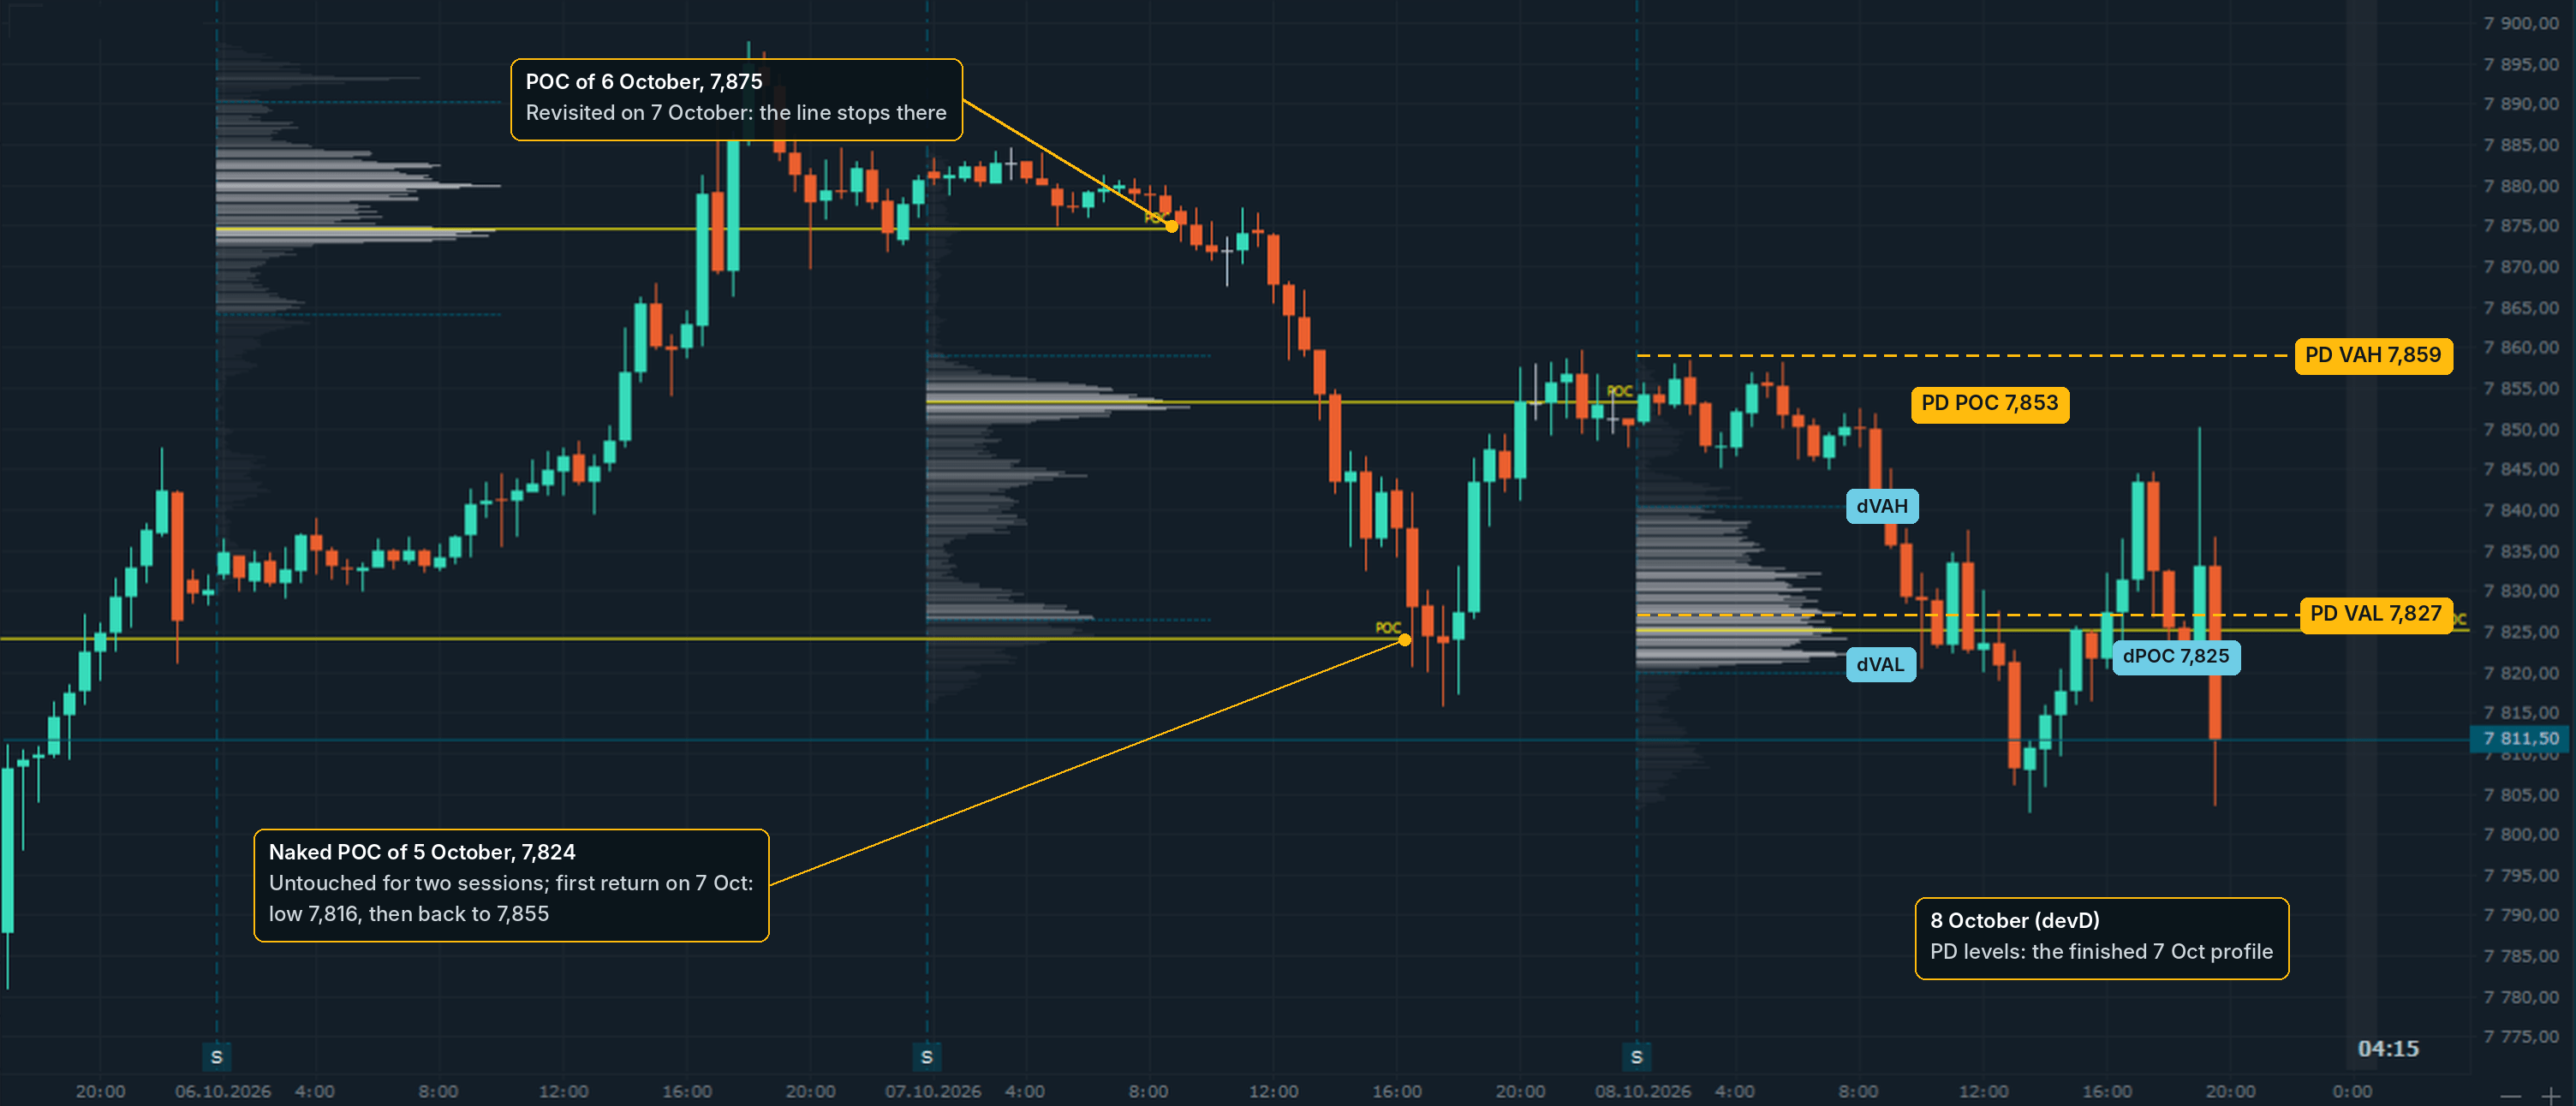
Two profiles are on the chart: the finished previous day, with the PD POC, PD VAH, PD VAL, PD High and PD Low, and the developing day (devD), with dPOC, dVAH and dVAL.
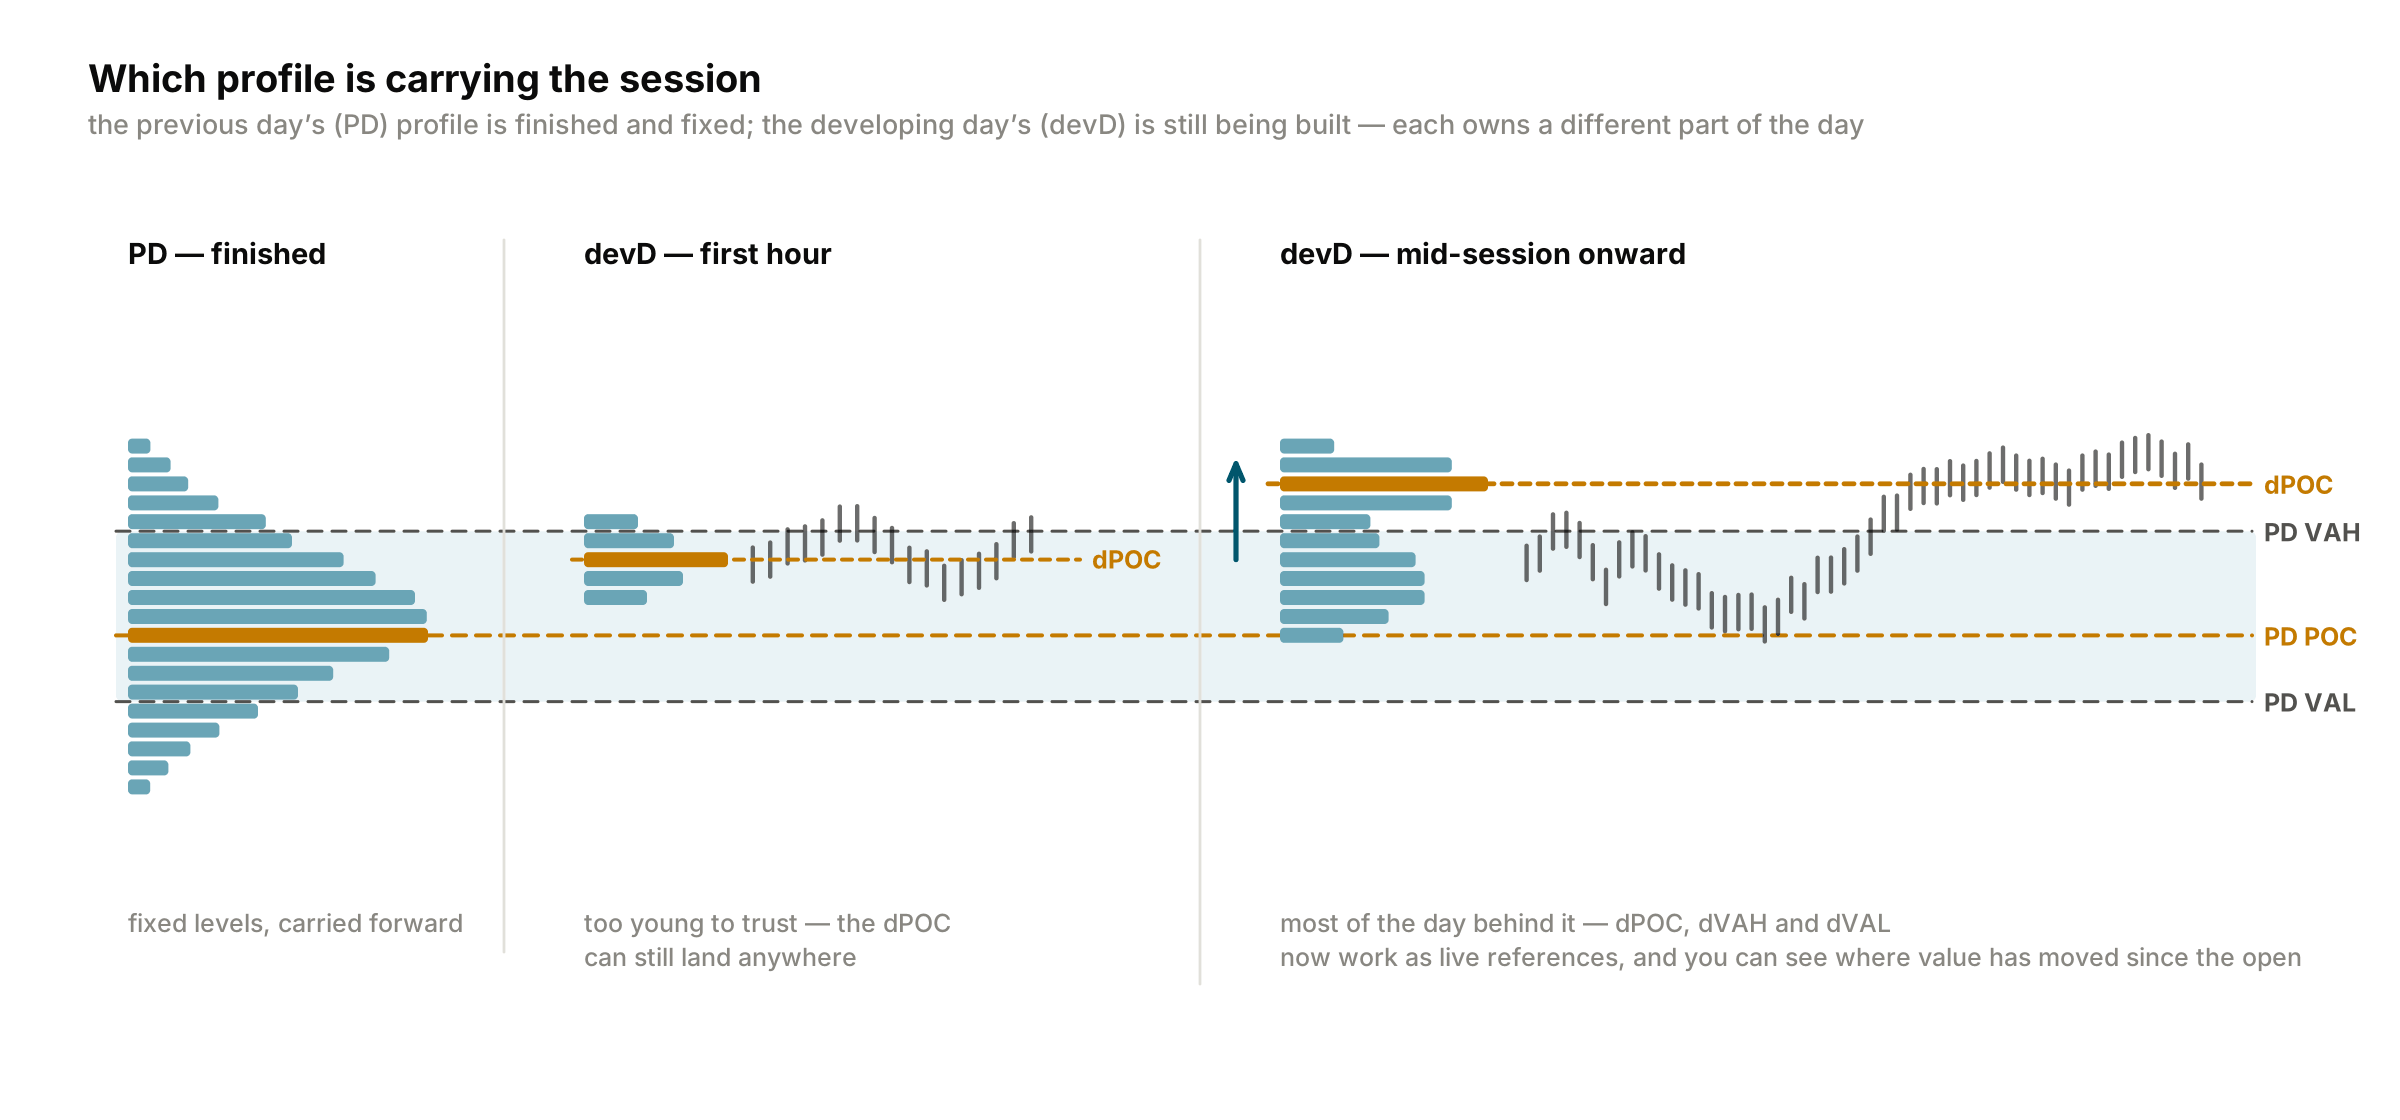
Early in the session use the PD levels: the developing profile has too little data yet. Later, track value migration: value that follows price confirms acceptance; a move that extends while value stays behind has not been accepted. Once price is accepted outside PD value, stop fading back into it: the nearest edge becomes the level for pullbacks.
A naked POC is a POC that price has not traded back to since its day ended. Use it as a target, and watch it for a reaction on the first return. In Quantower, daily Step profiles with POC intersection type set to Until Bar draw each POC line until a bar trades through it.
TPO vs Volume Profile: Time and Volume at Price
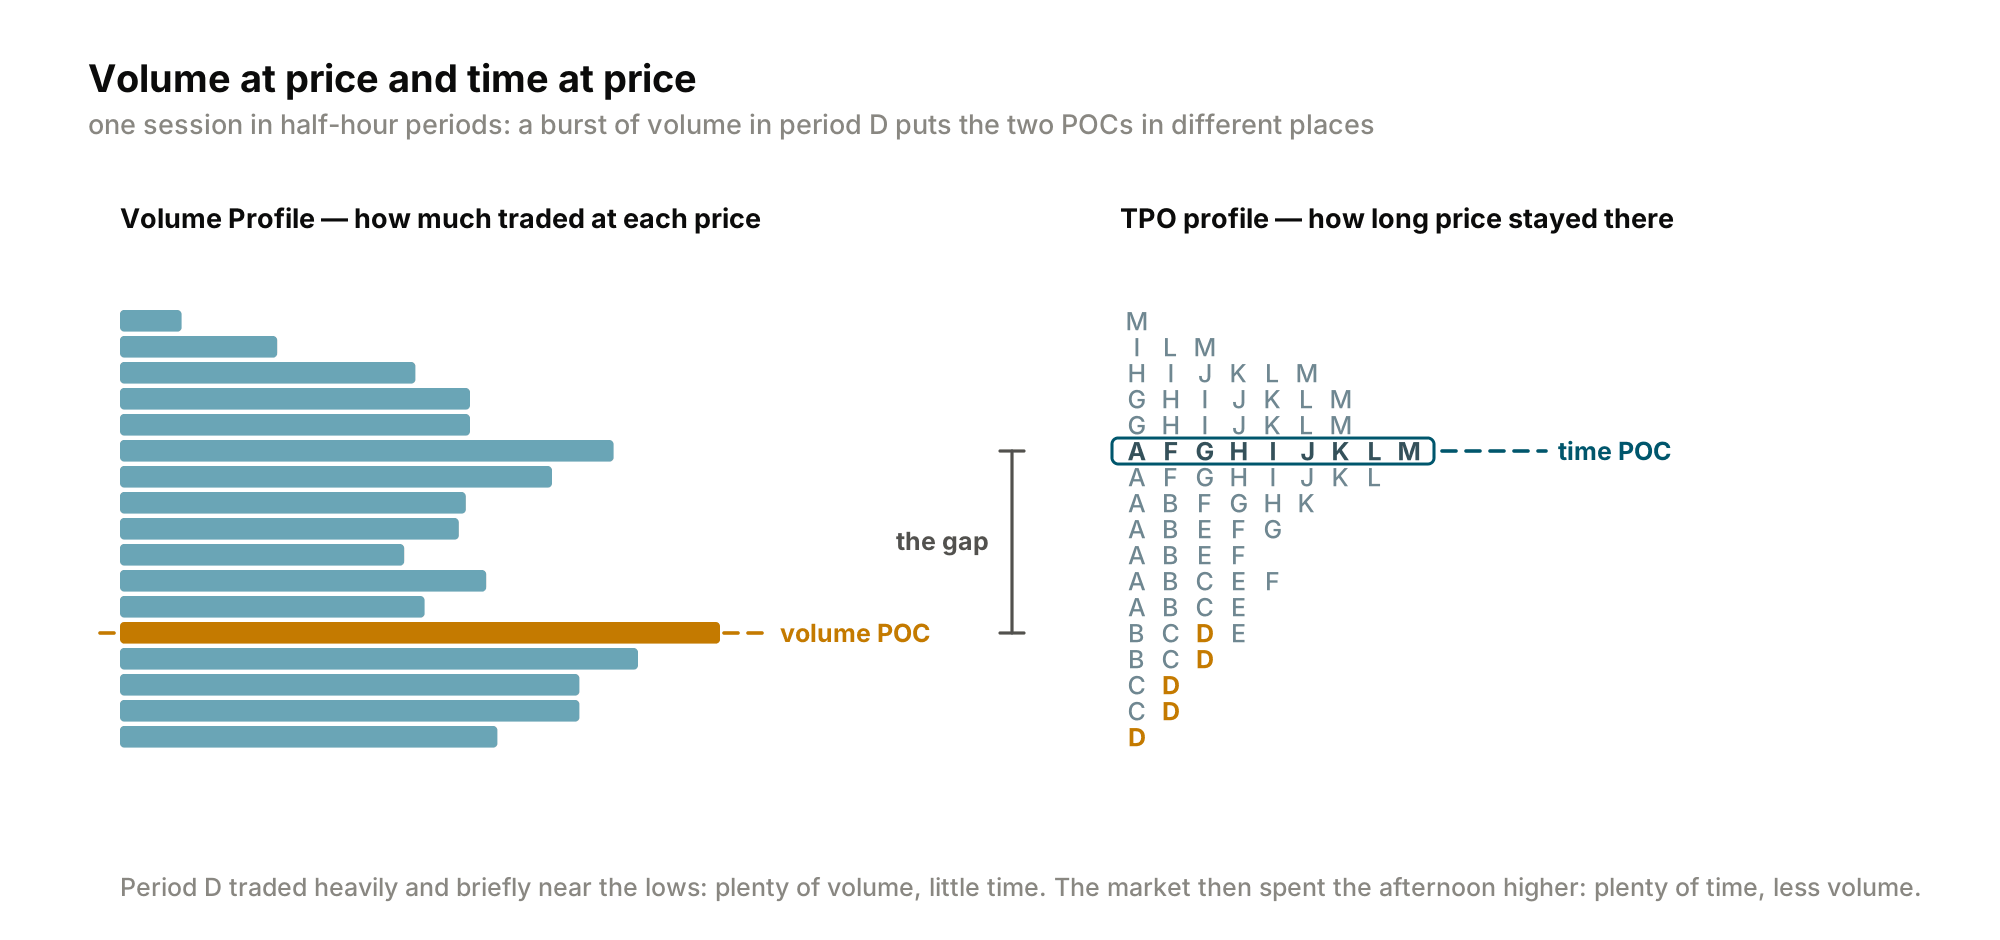
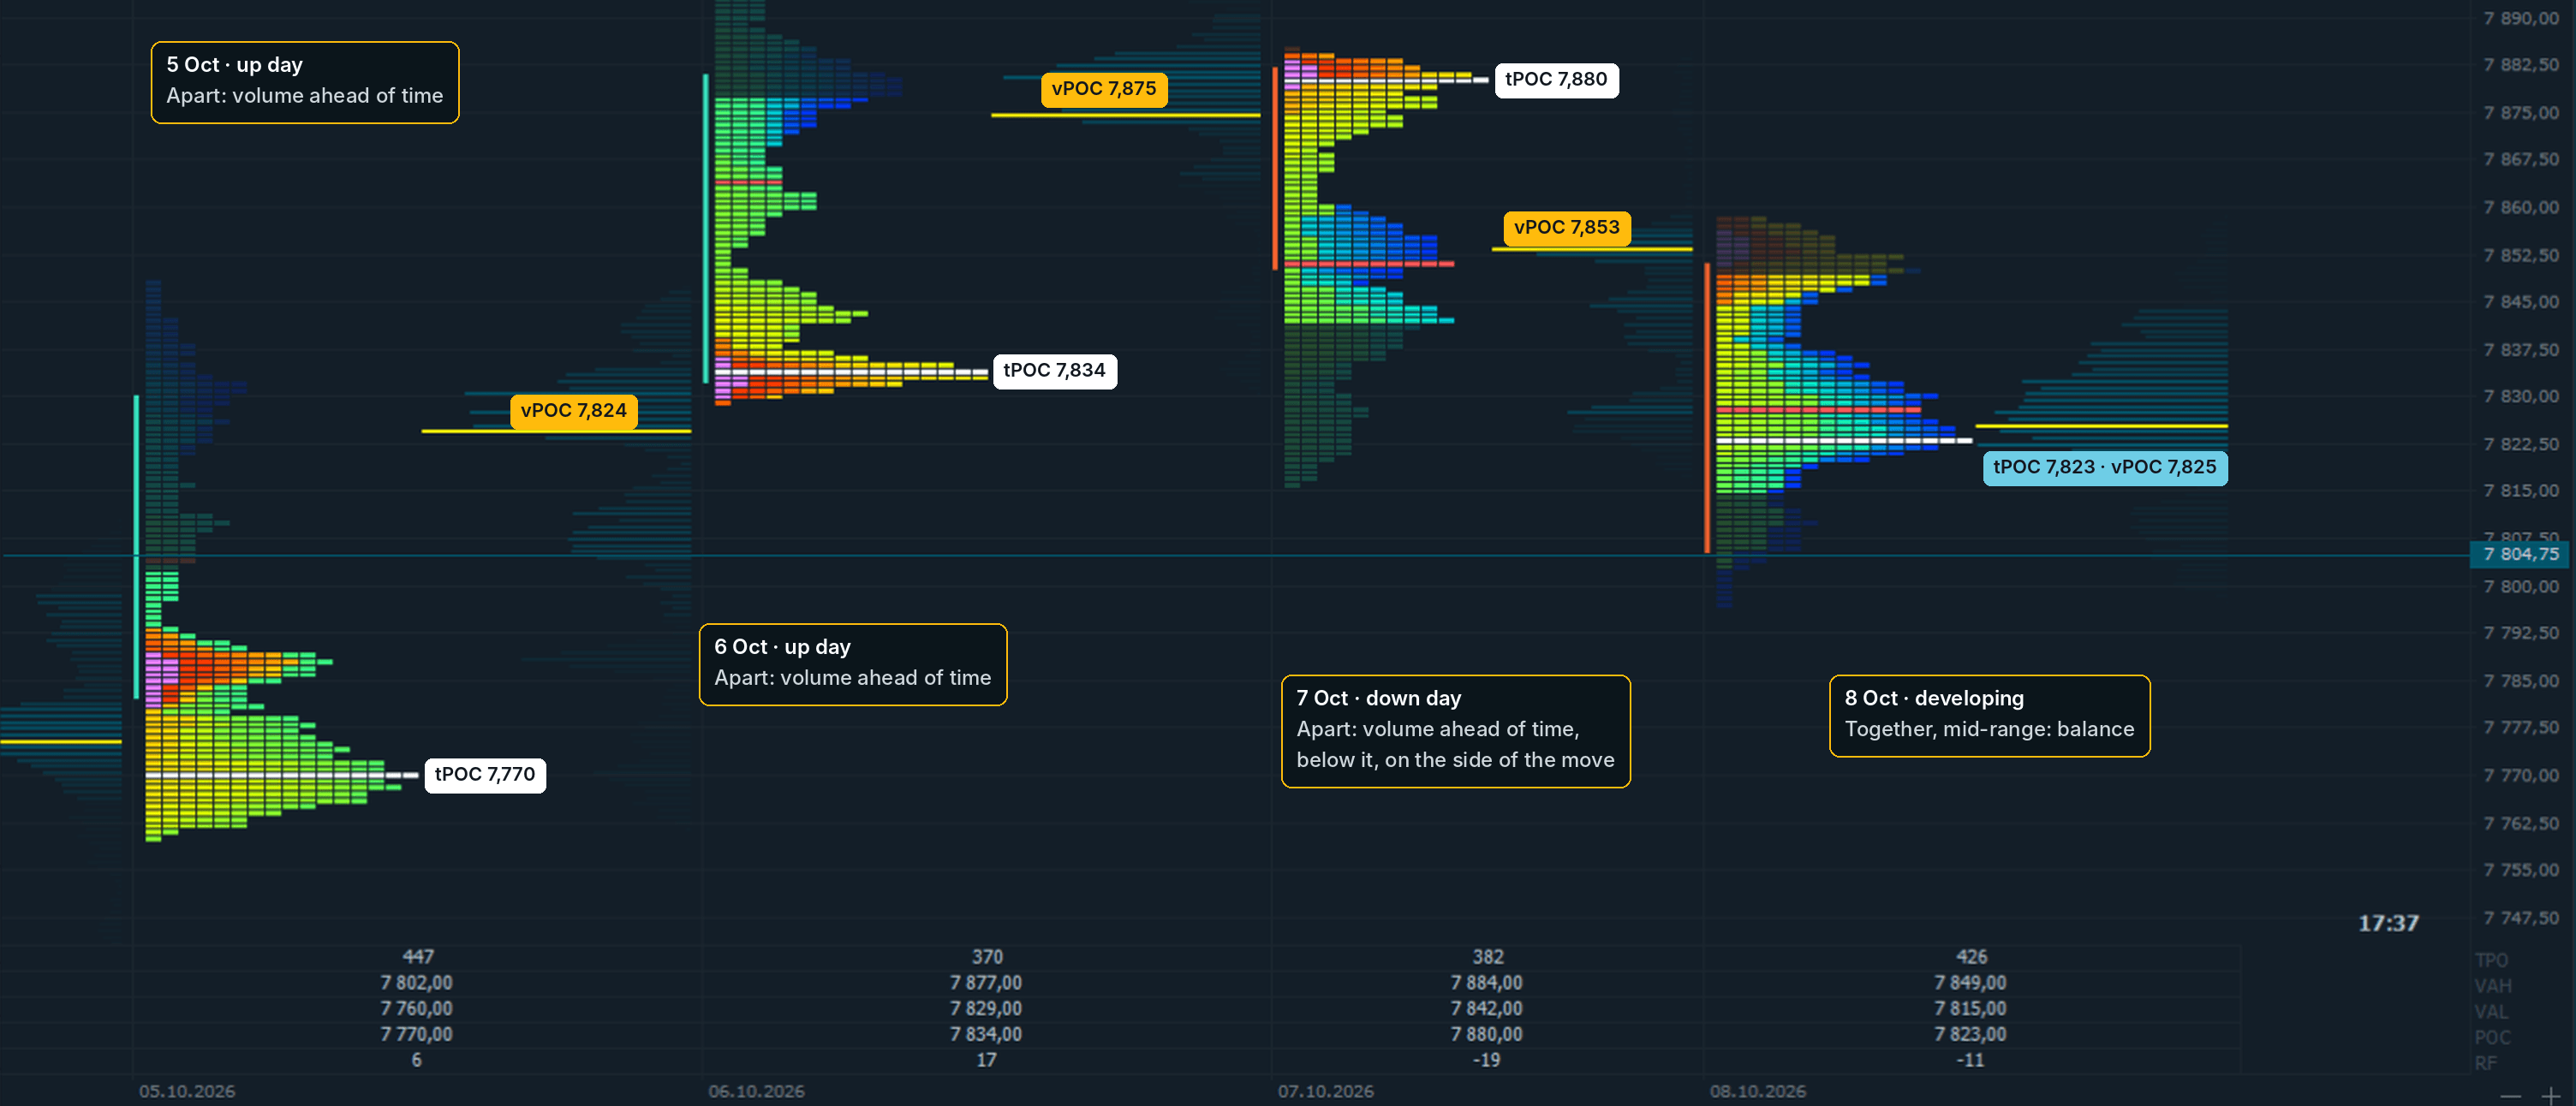
The TPO profile measures time instead of volume: each 30-minute bracket prints a TPO at every price it trades (Quantower draws the marks as boxes by default; Letters is an option under STYLE). The price with the most TPOs is the time POC (tPOC); the POC of the volume profile is the volume POC (vPOC). The first hour is the initial balance. Single prints are prices traded in one bracket only: a fast, one-sided move that often gets revisited.
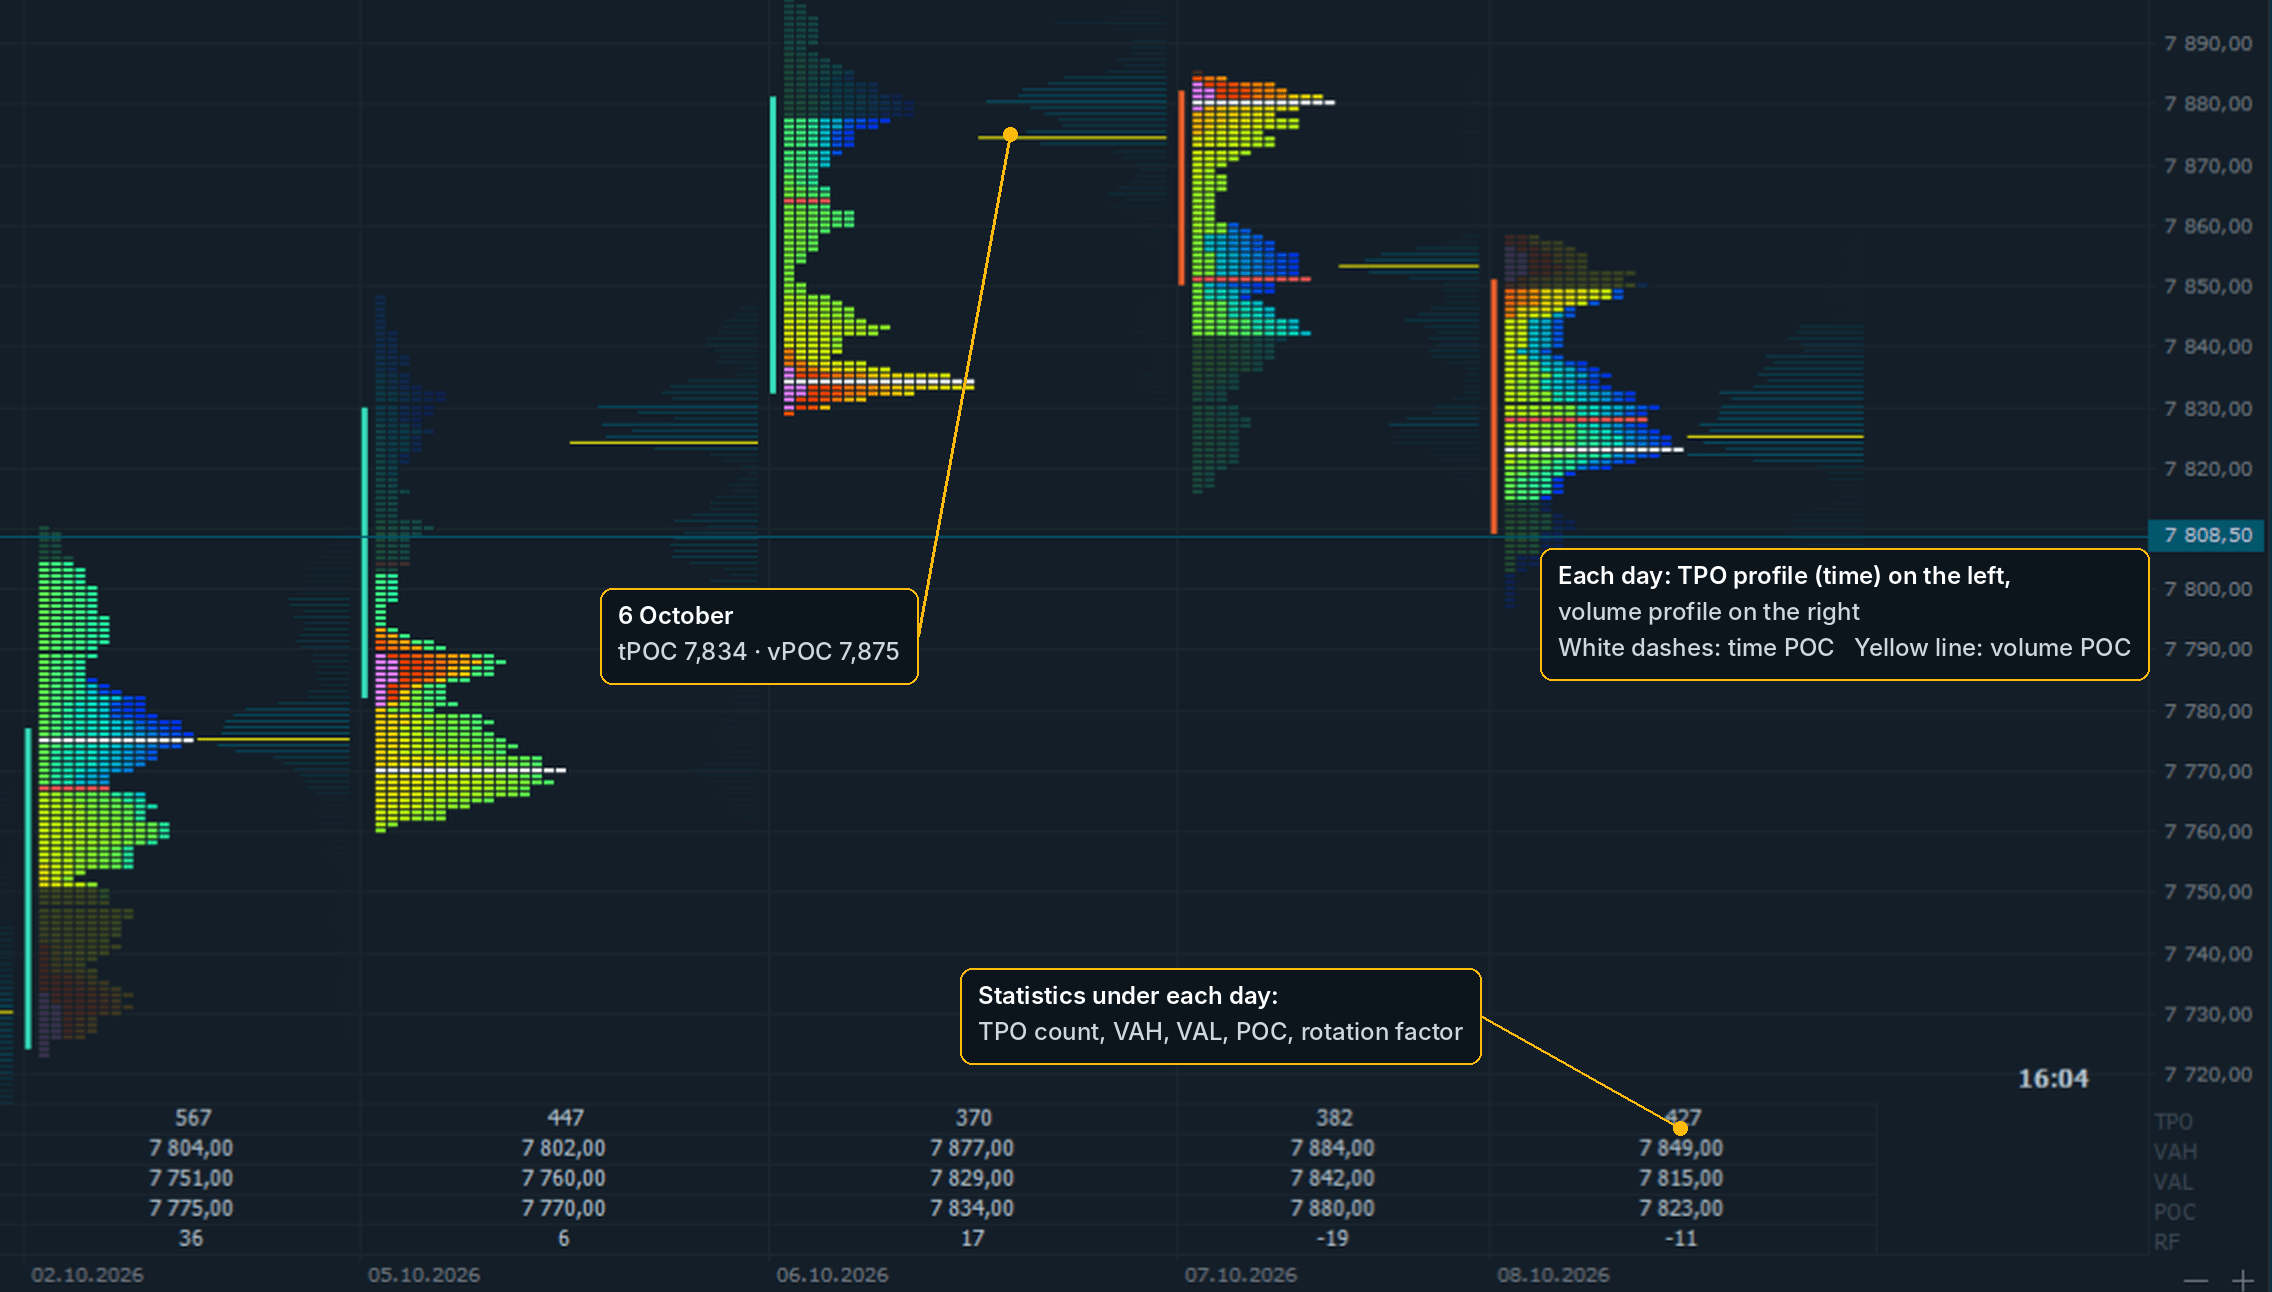
In Quantower this is the TPO Chart panel. Turn on VOLUME ANALYSIS to draw each day’s volume profile next to its TPO profile; the table under the profiles lists both POCs and the value area.
Time POC vs Volume POC: Reading the Difference
Most days the two POCs sit at the same price. Then check where that price is relative to the day’s move. The CBOT Market Profile handbook gives three cases. At the end of the move: value followed price, continuation is likely. At the start of the move: price ran ahead of value, expect a pause or a return. In the middle: balance.
When the two POCs are far apart, look at which one is on the side of the move. Volume POC ahead: size was done at the new prices, but the market has not built time there yet. Volume POC behind: the market built time at the new prices without size. Both are common on full-day profiles, because the overnight hours add time and the cash session adds volume. The next session shows which reading was right.
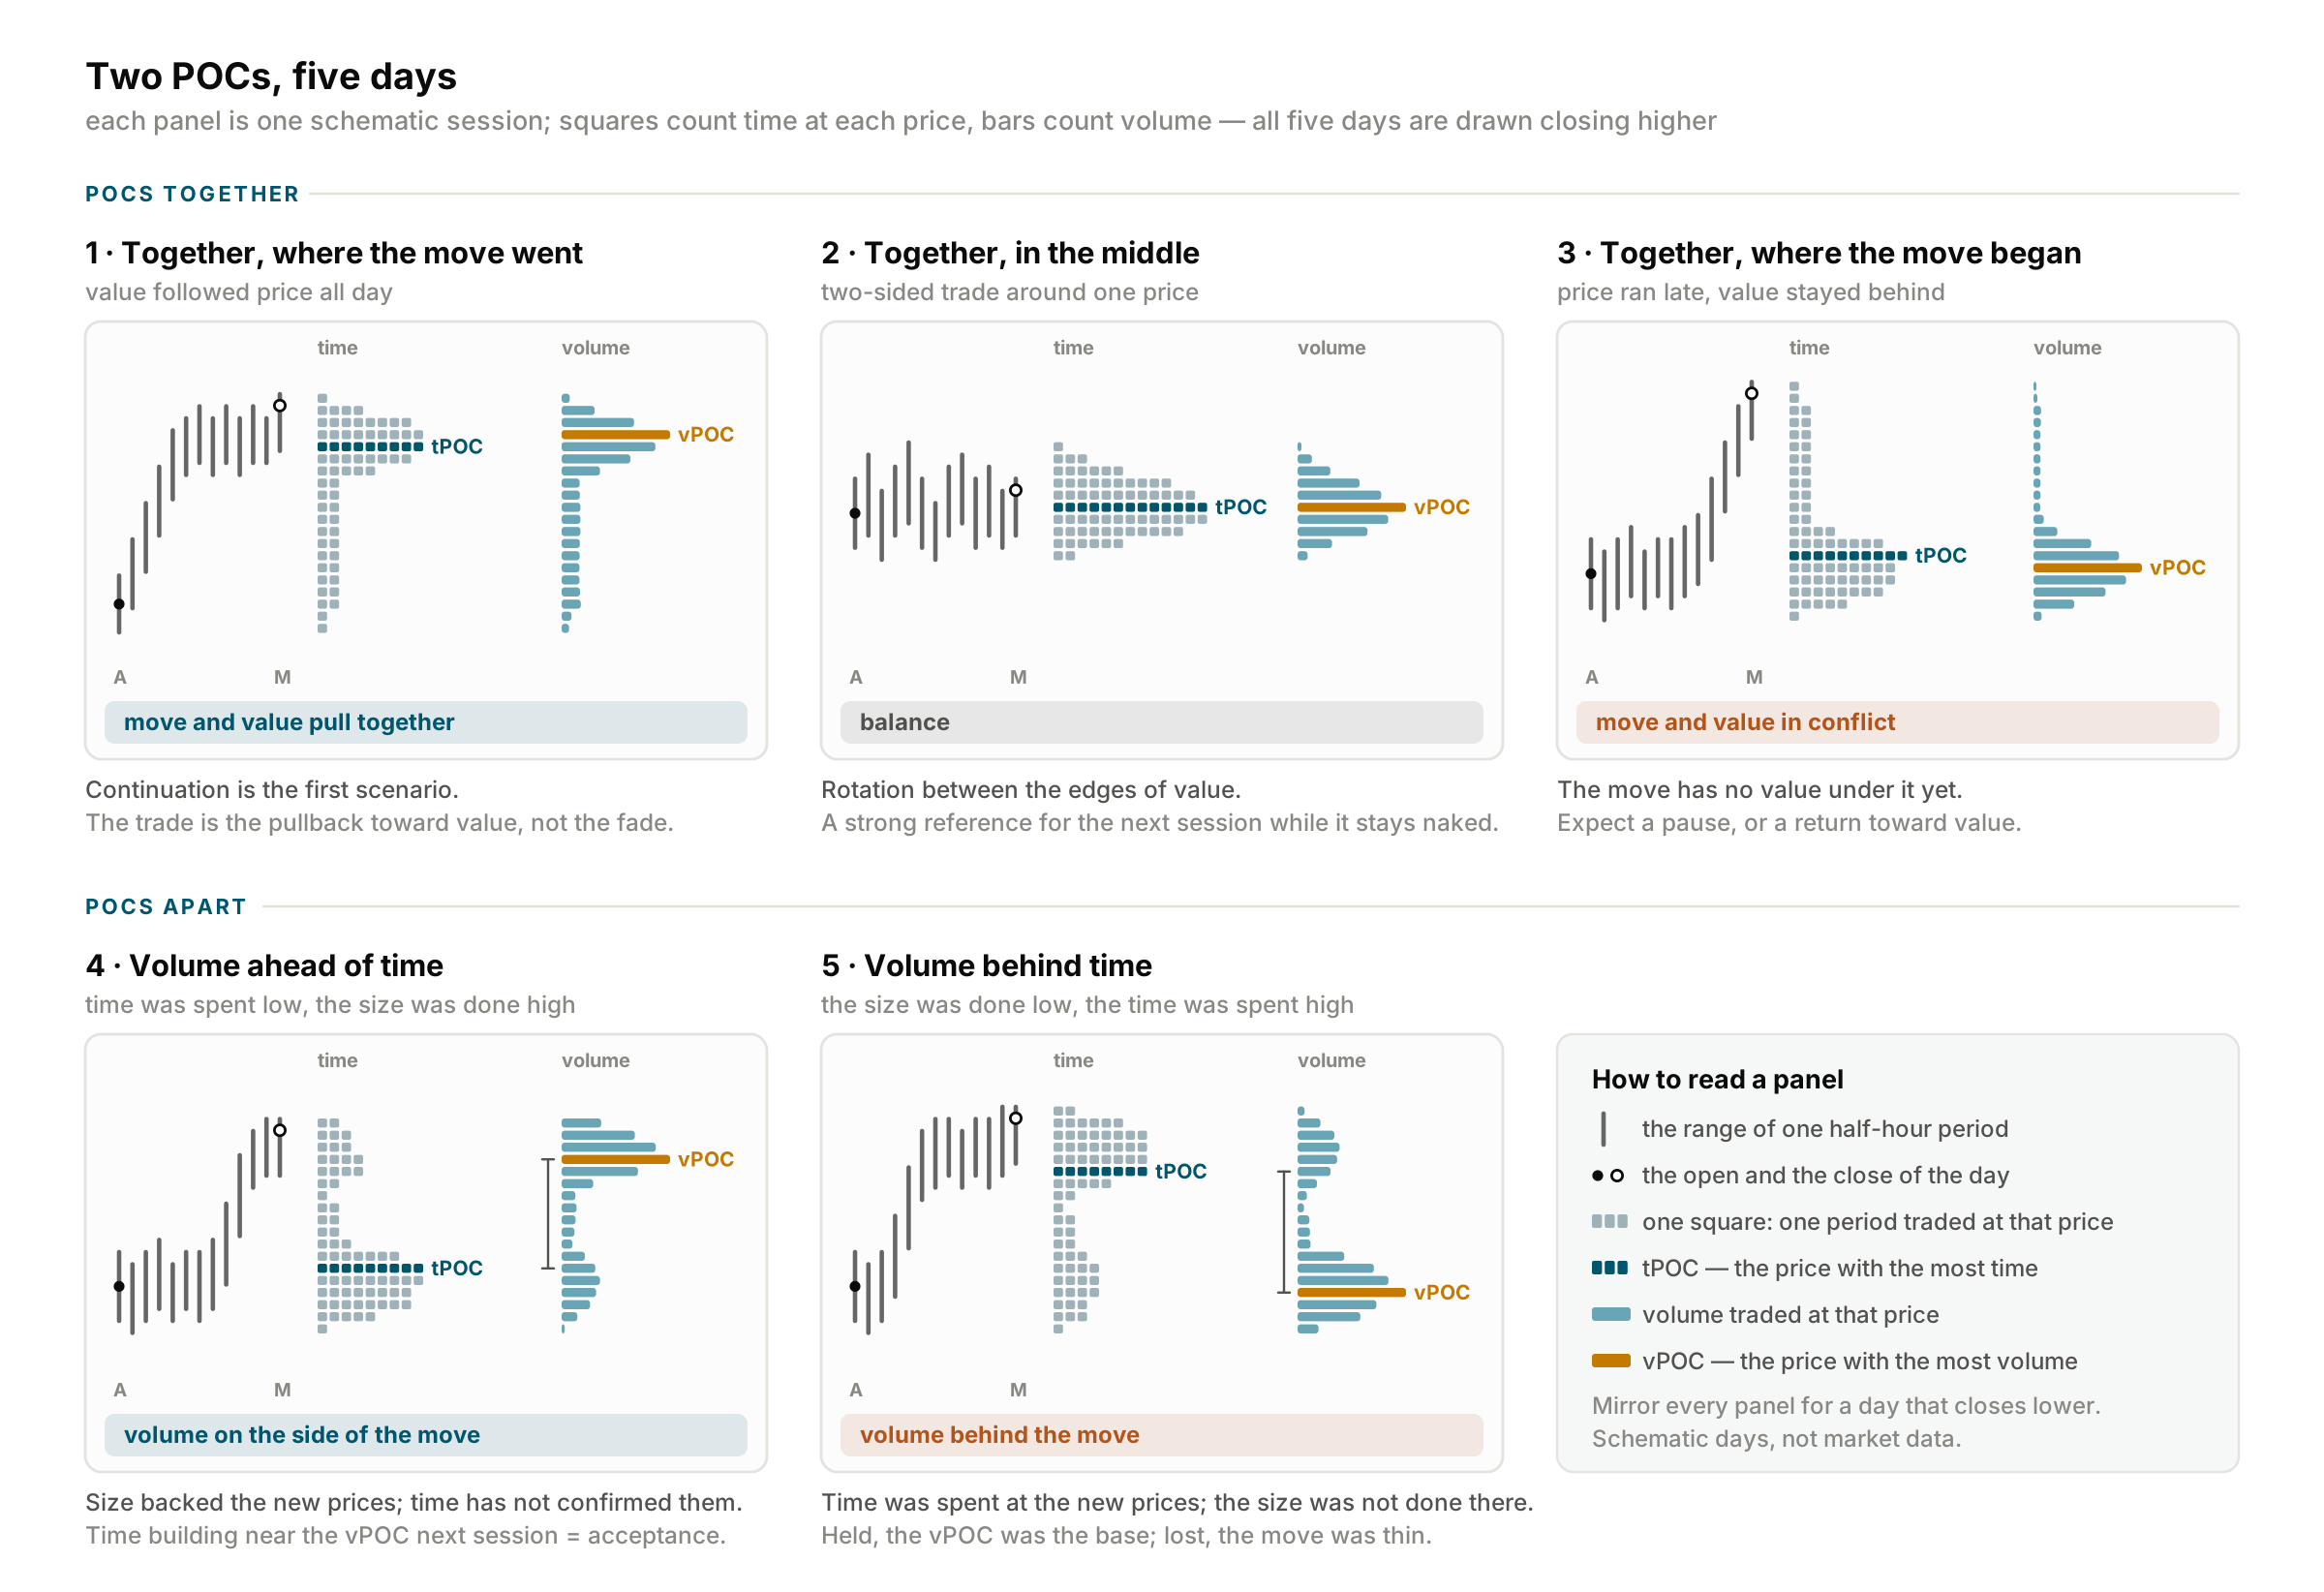
PD session left | Read | First scenario | Confirms / cancels |
POCs together, where the move went | Value followed price | Continuation: buy the pullback toward PD value | Confirms: devD value builds beyond the PD POC. Cancels: acceptance back through PD value |
POCs together, mid-range | Balance | Rotation between the edges of PD value | Cancels: an open outside PD value, or acceptance beyond an edge |
POCs together, where the move began | Conflict: price ran ahead of value | A pause, or a return toward the PD POC | Confirms: no acceptance beyond the PD extreme. Cancels: devD value builds beyond it |
POCs apart, volume ahead of time | Size at the new prices, not yet accepted | Acceptance, then continuation | Confirms: devD spends time at the PD vPOC. Cancels: a fast return to the PD tPOC |
POCs apart, volume behind time | Time at the new prices, size at the origin | A test of the PD vPOC | Holds: it was the base of the move. Trades through: the move was thin |
None of these cases is a signal. Each gives a first scenario for the next open and the condition that cancels it. Compare only POCs built with the same session and row size, and treat two POCs inside one high-volume area as one level.
Order Flow Confirmation: Absorption vs Initiative
Profiles show executed history. The footprint shows the flow hitting the level now. Aggressive buyers lift the offer and print at the ask; aggressive sellers hit the bid and print at the bid. Delta is ask volume minus bid volume. The Cluster chart is Quantower’s footprint: it shows bid and ask volume at every price of every bar.
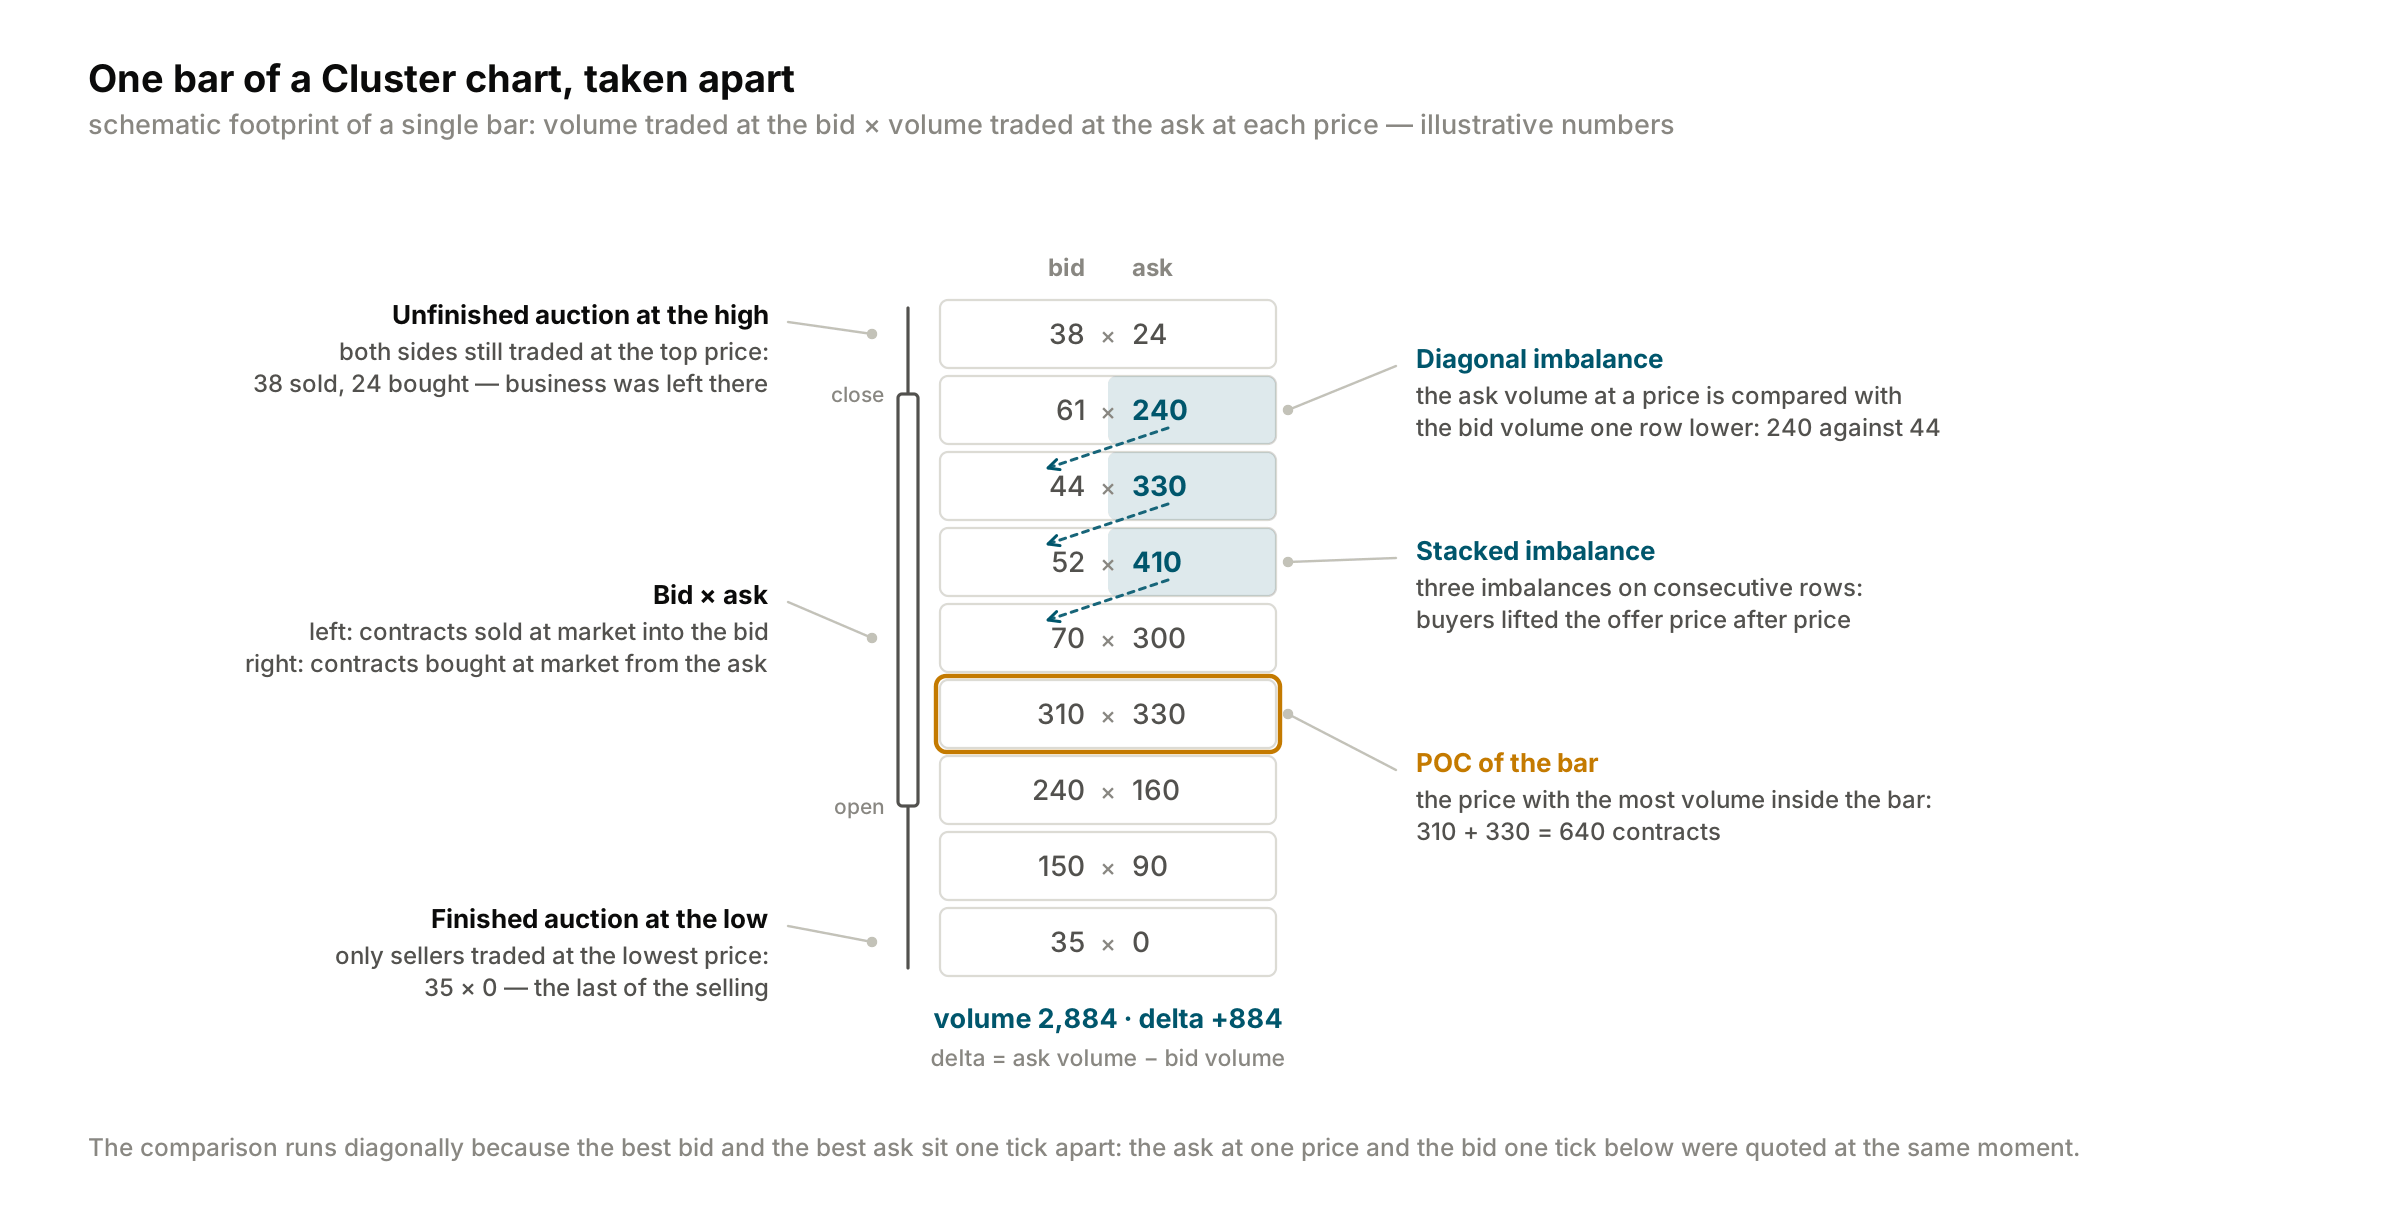
Read three things in a bar. Imbalance: ask volume at a price is several times the bid volume one tick lower (the multiple is the Ratio setting); the mirror for sellers. Stacked imbalance: three or more such prices in a row: one side is in control. Unfinished auction: the bar’s high or low has volume on both sides; price often comes back to it.
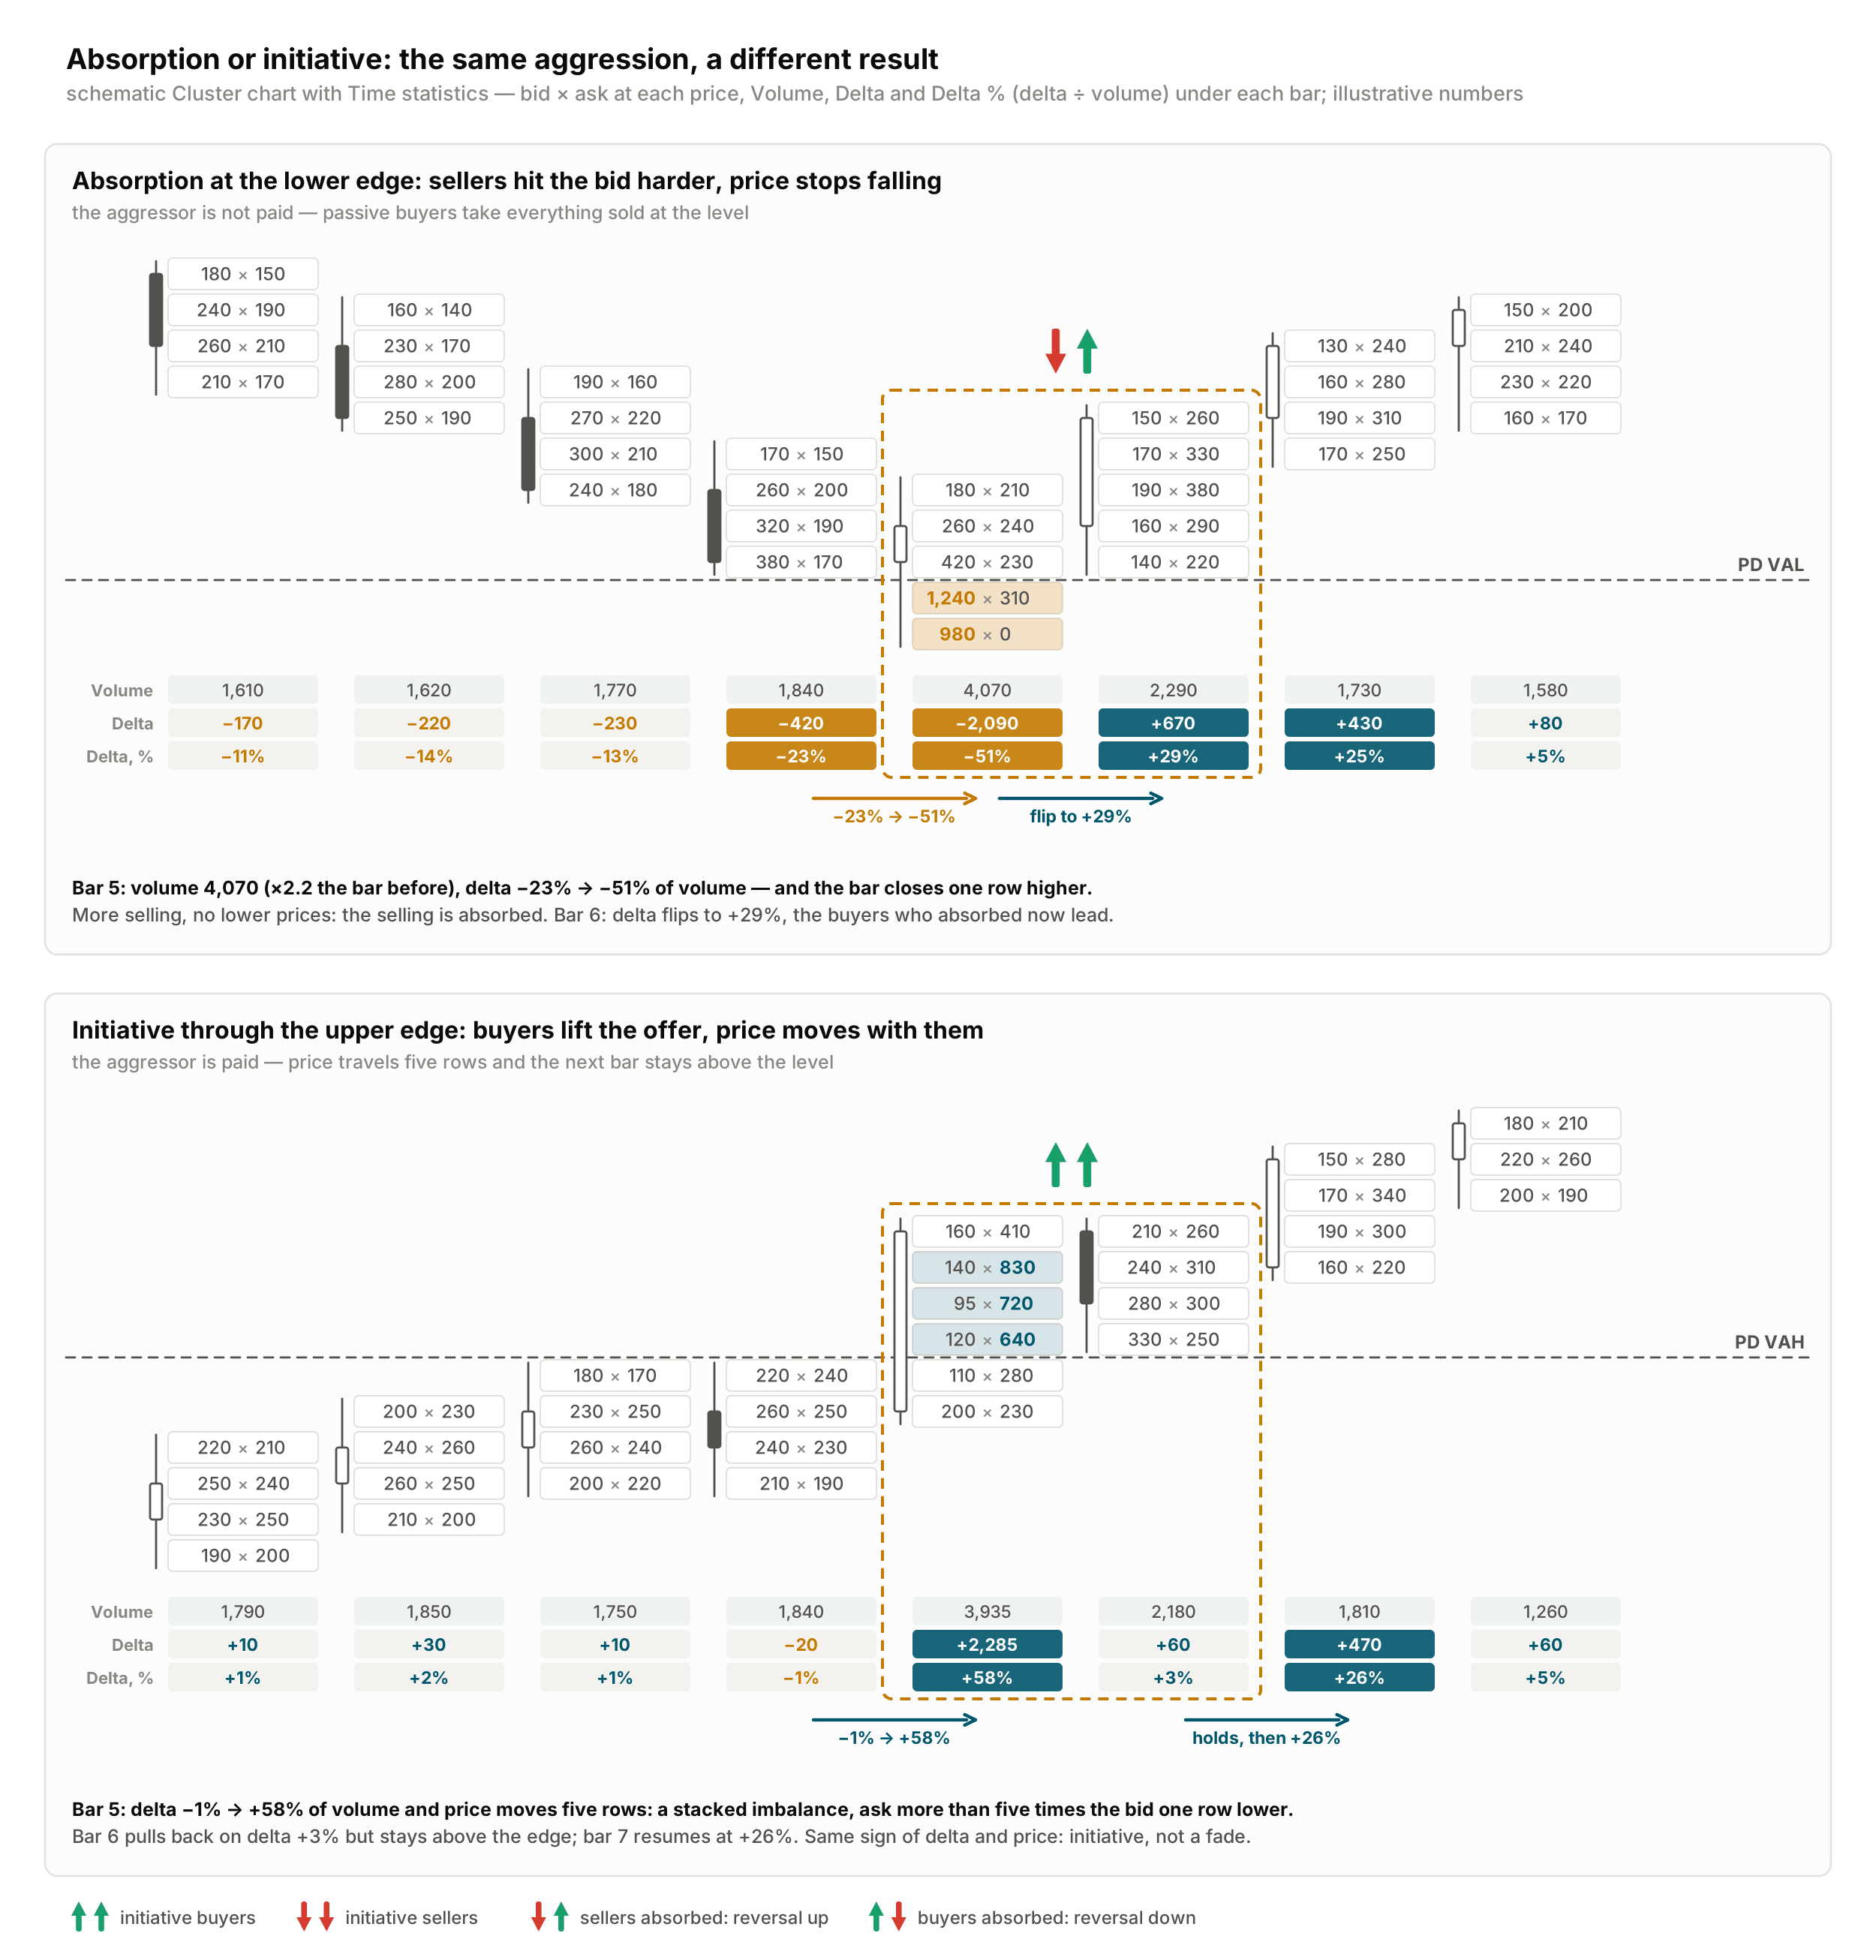
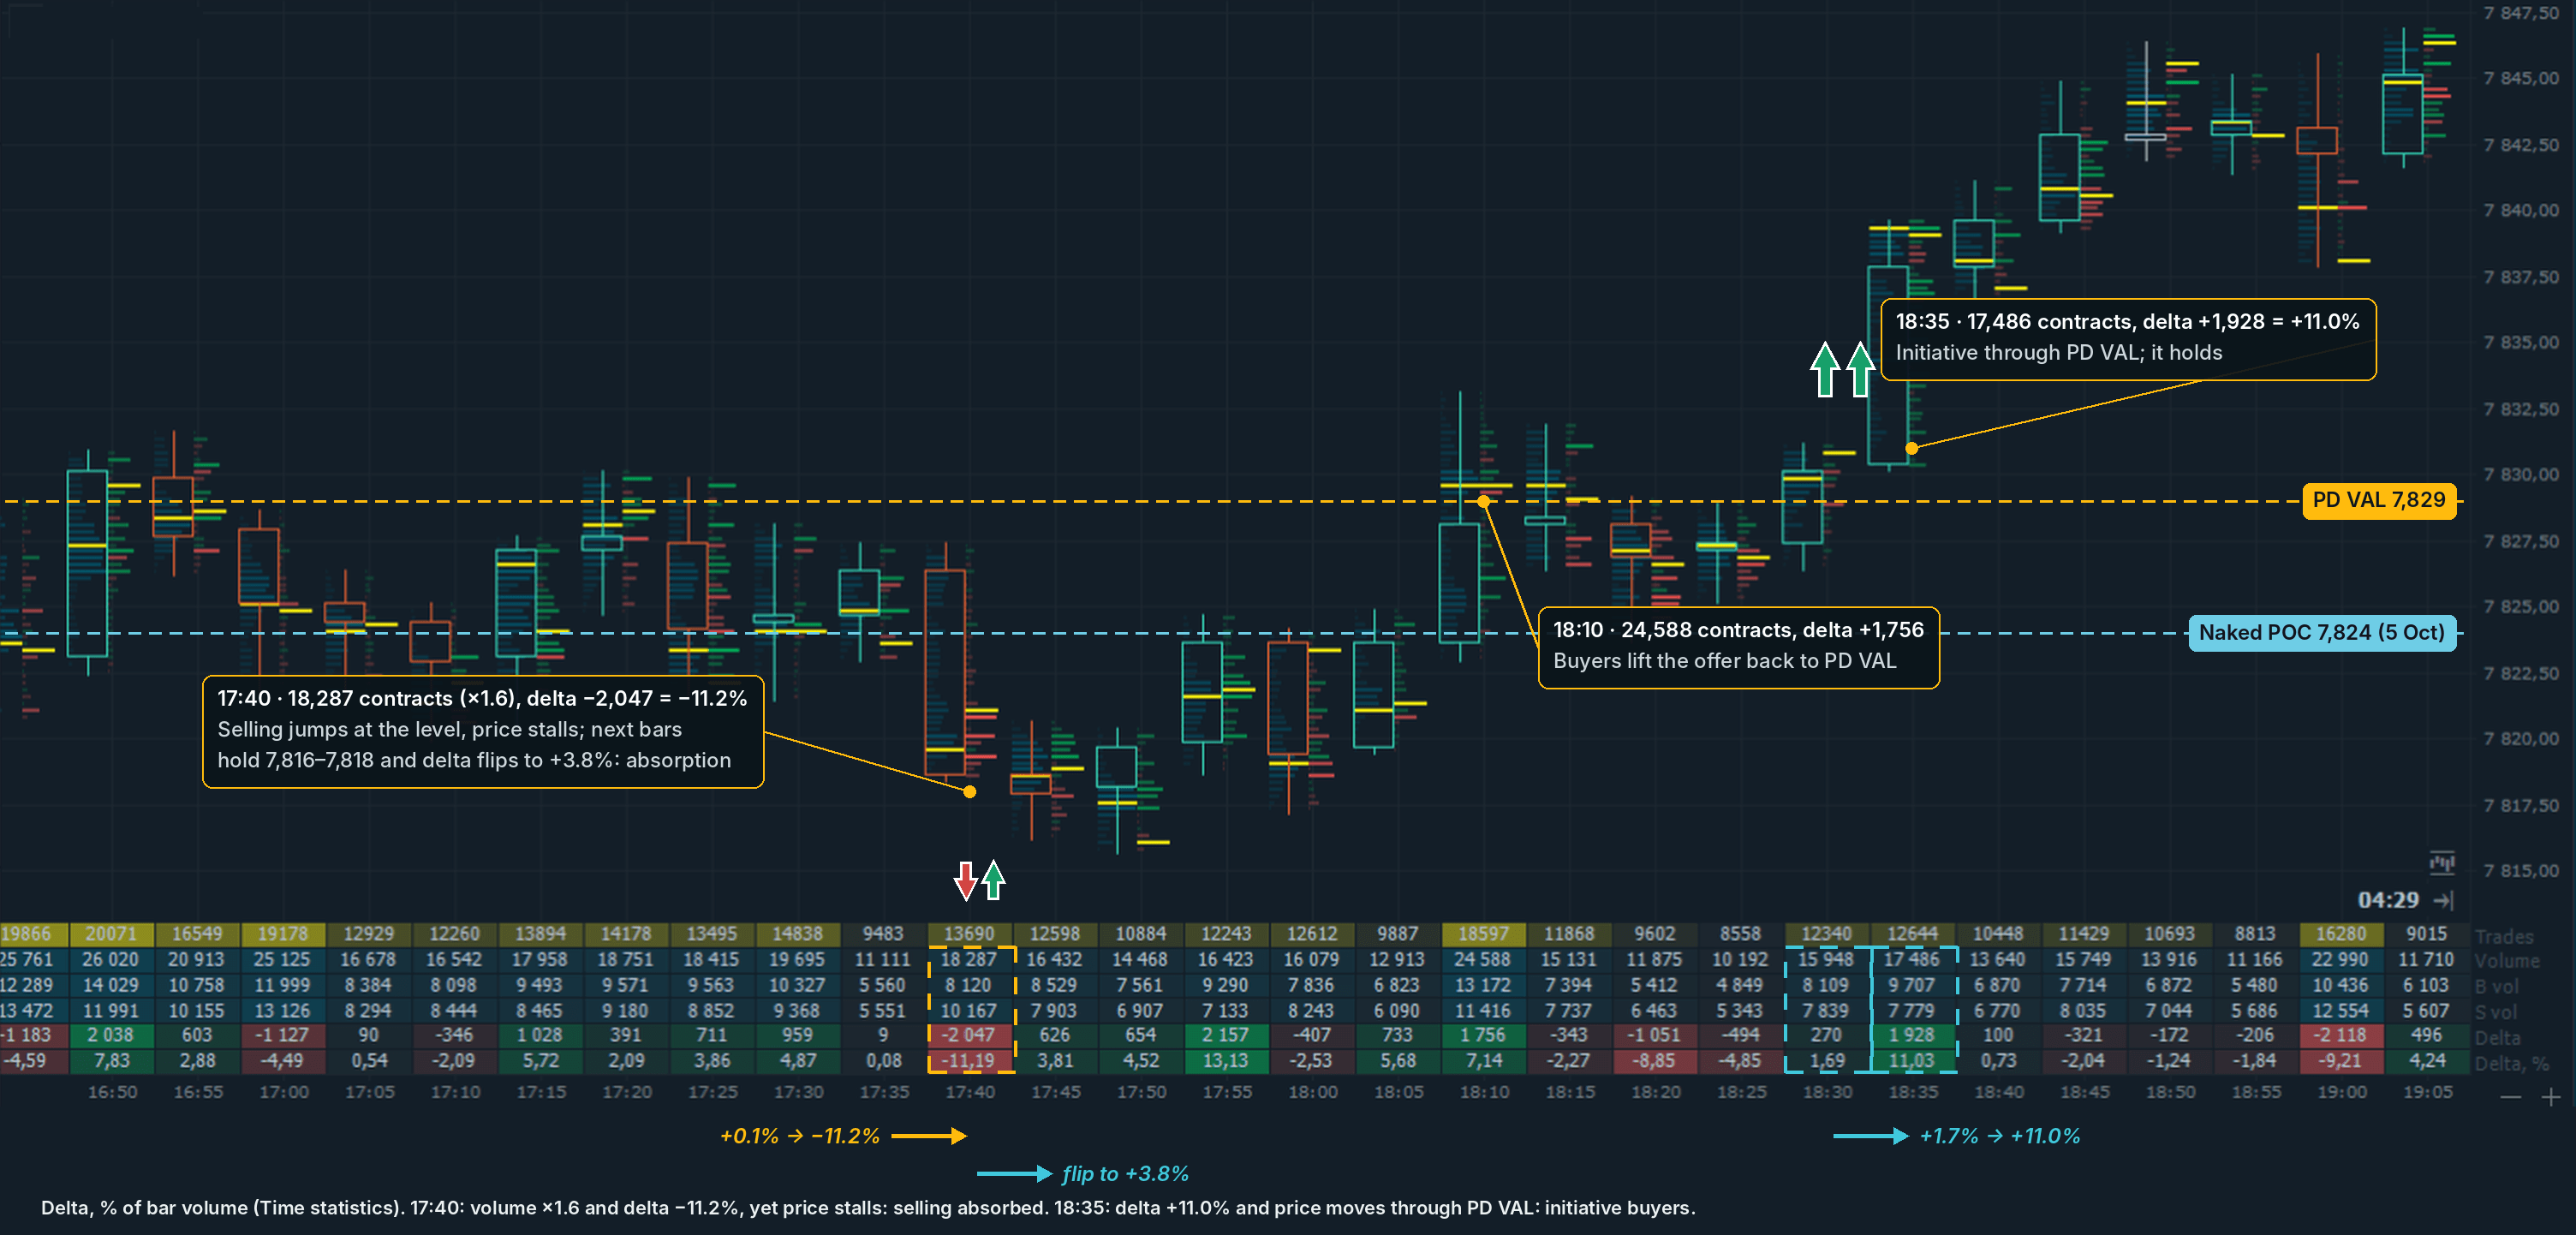
At a level marked in advance, ask two questions: is aggressive flow arriving, and is price making progress because of it? The answer separates the two reactions worth trading. Absorption: aggression grows, but price does not move. Sellers hit the bid harder (volume jumps, delta as a share of volume becomes strongly negative), yet the bar makes no real progress below the level and closes off its low. Resting limit orders, passive buyers, take the other side of every lot. The next bar shows it: delta flips to the other side and price moves away from the level. Initiative: aggression grows, and price moves with it. Delta and the bar move in the same direction, imbalances stack on several prices in a row, and the next bar stays beyond the level. In short: effort versus result. Absorption is effort without result; initiative is effort with result.
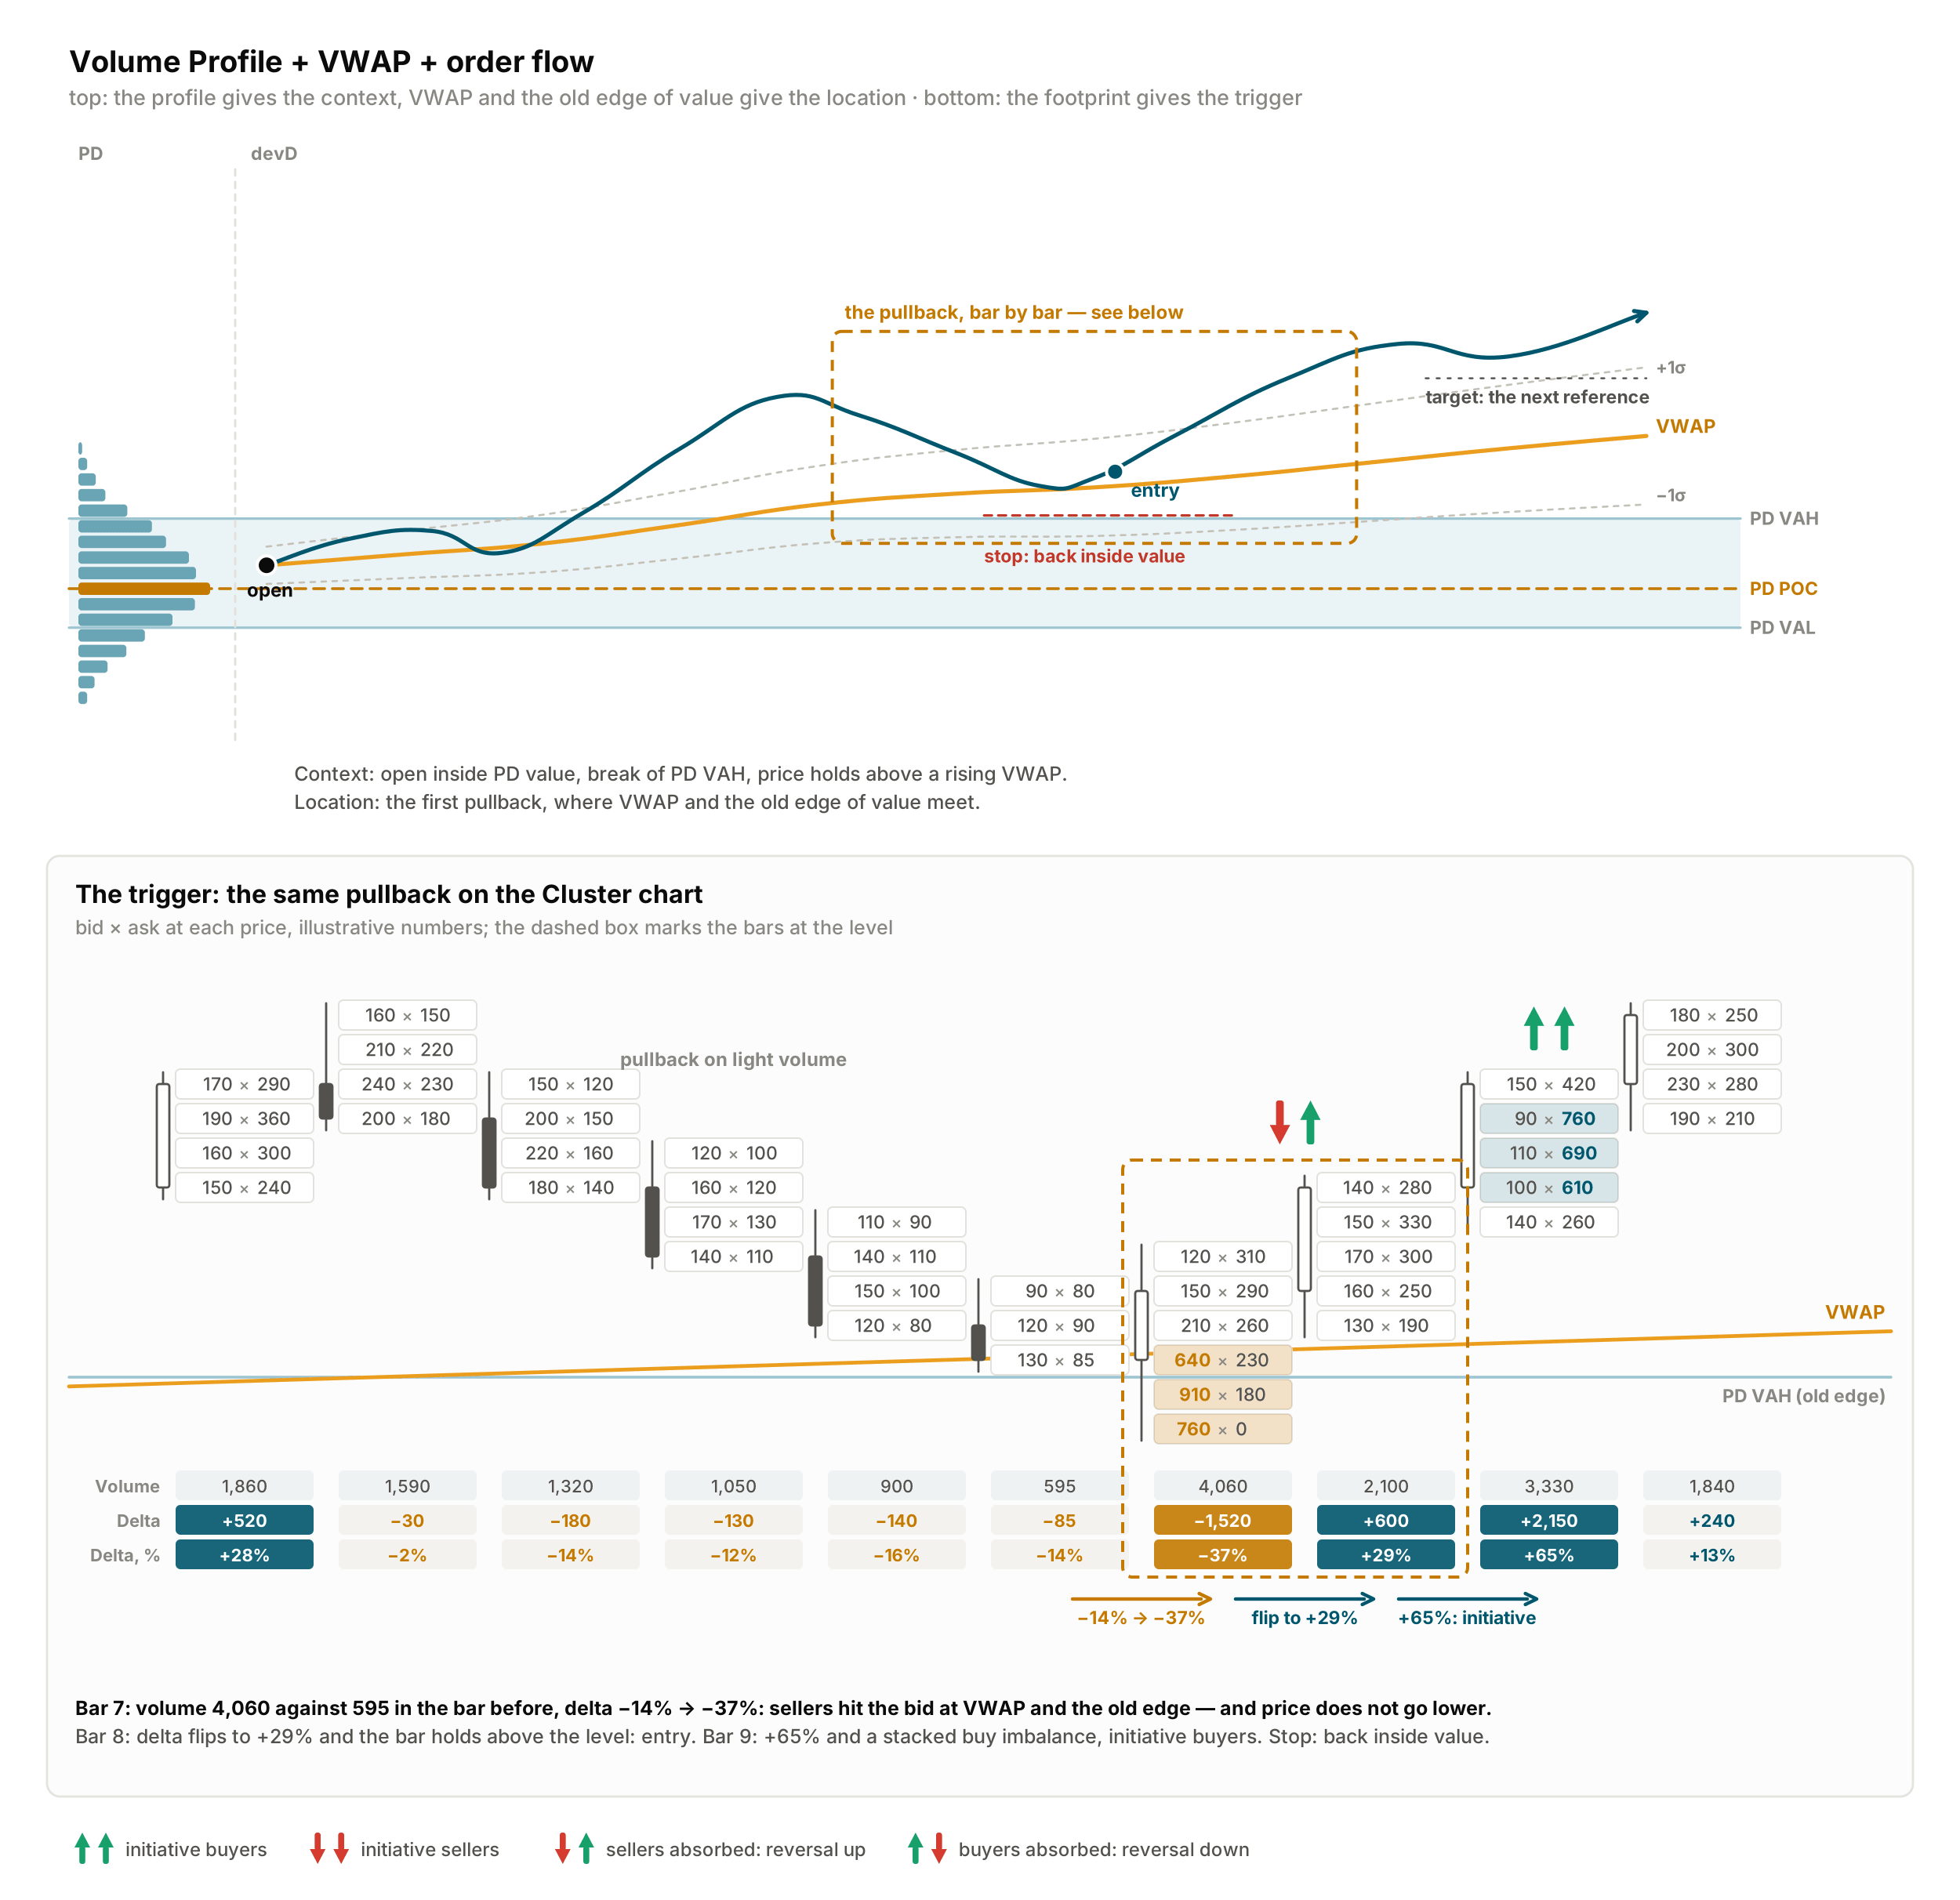
Read delta as a share of the bar’s volume (Delta, % in Quantower’s Time statistics), not as a raw number: the same −400 is heavy in a quiet bar and nothing in a busy one. Compare it with the bars before the level. In the figure below, delta goes from −23% to −51% at PD VAL while price stops falling: absorption. At PD VAH it goes from −1% to +58% and price travels five rows: initiative. Arrows on the charts: two green up, initiative buyers; two red down, initiative sellers; red down and green up, selling absorbed and price turns up; green up and red down, buying absorbed and price turns down.
At the level | Read | Trade it supports |
Heavy selling at the level, no downside progress, the bar closes off its low | Absorption: passive buyers absorb the selling | Long from the level |
Stacked buy imbalances, positive delta on the break, the next bars stay above | Initiative: buyers lift offers through the level | Buy the pullback to the level |
Volume on both sides at the bar’s high or low | Unfinished auction | A target, not an entry |
Exhaustion is often confused with absorption, because both can end a move. The difference is in the volume. Absorption shows more aggression and more volume at the level, with passive orders on the other side. Exhaustion shows less: the move reaches a new high or low on falling volume, the last prices trade only a few lots, and delta fades toward zero. No one absorbed the move; aggressive participation simply dried up. Exhaustion is harder to see in real time, often clear only a few bars later, and the volumes are small. This guide does not trade it and does not recommend it: absorption and initiative give stronger and more reliable signals.
On the footprint | Absorption | Initiative | Exhaustion |
Volume at the level | Rises sharply | Rises sharply | Falls |
Delta, % of volume | Strong, against the bar’s result | Strong, in the bar’s direction | Fades toward zero |
Price | Stalls; the bar closes off its extreme | Moves several rows; imbalances stack | Makes a new extreme on a few lots, then stalls |
Next bar | Delta flips, price moves away | Holds beyond the level | Unclear; confirmed only later |
Use in this guide | Fade from the level | Trade with it on the pullback | Not traded |
CONCLUSION | TRADABLE | NOT TRADABLE | |
Order flow confirms a level; it does not create one. Absorption in the middle of value means nothing: without a level, the footprint is noise. Cumulative delta and its divergences belong to the same toolkit and need a guide of their own.
Two Volume Profile Trading Strategies
Both combinations follow the same three steps: context, level, trigger. The trigger is always the footprint. The difference is the level: in the first it is a fixed profile level; in the second it is VWAP where it meets a profile level.
Step | VP + TPO + order flow | VP + VWAP + order flow |
Context | Open vs PD value; where the two PD POCs sit | Open vs PD value; price vs VWAP and its slope |
Level | PD POC, an edge of PD value or a naked POC, marked before price gets there | VWAP or its band where it meets a profile level |
Trigger | Footprint at the level: absorption or initiative | Footprint at VWAP and the level |
Best for | Levels planned before the open; the first test of the day | Intraday trades in a trending or rotating session |
Volume Profile + TPO + Order Flow
Before the open, the profiles give the plan: where the session opens relative to PD value, and where the two PD POCs sit. That gives the first scenario and the level to watch. Waiting for half-hour closes beyond the level is slow; by then a good part of the move is gone. The footprint shows the reaction while it happens. Check three things: is volume expanding, who is the aggressor, and is price making progress?
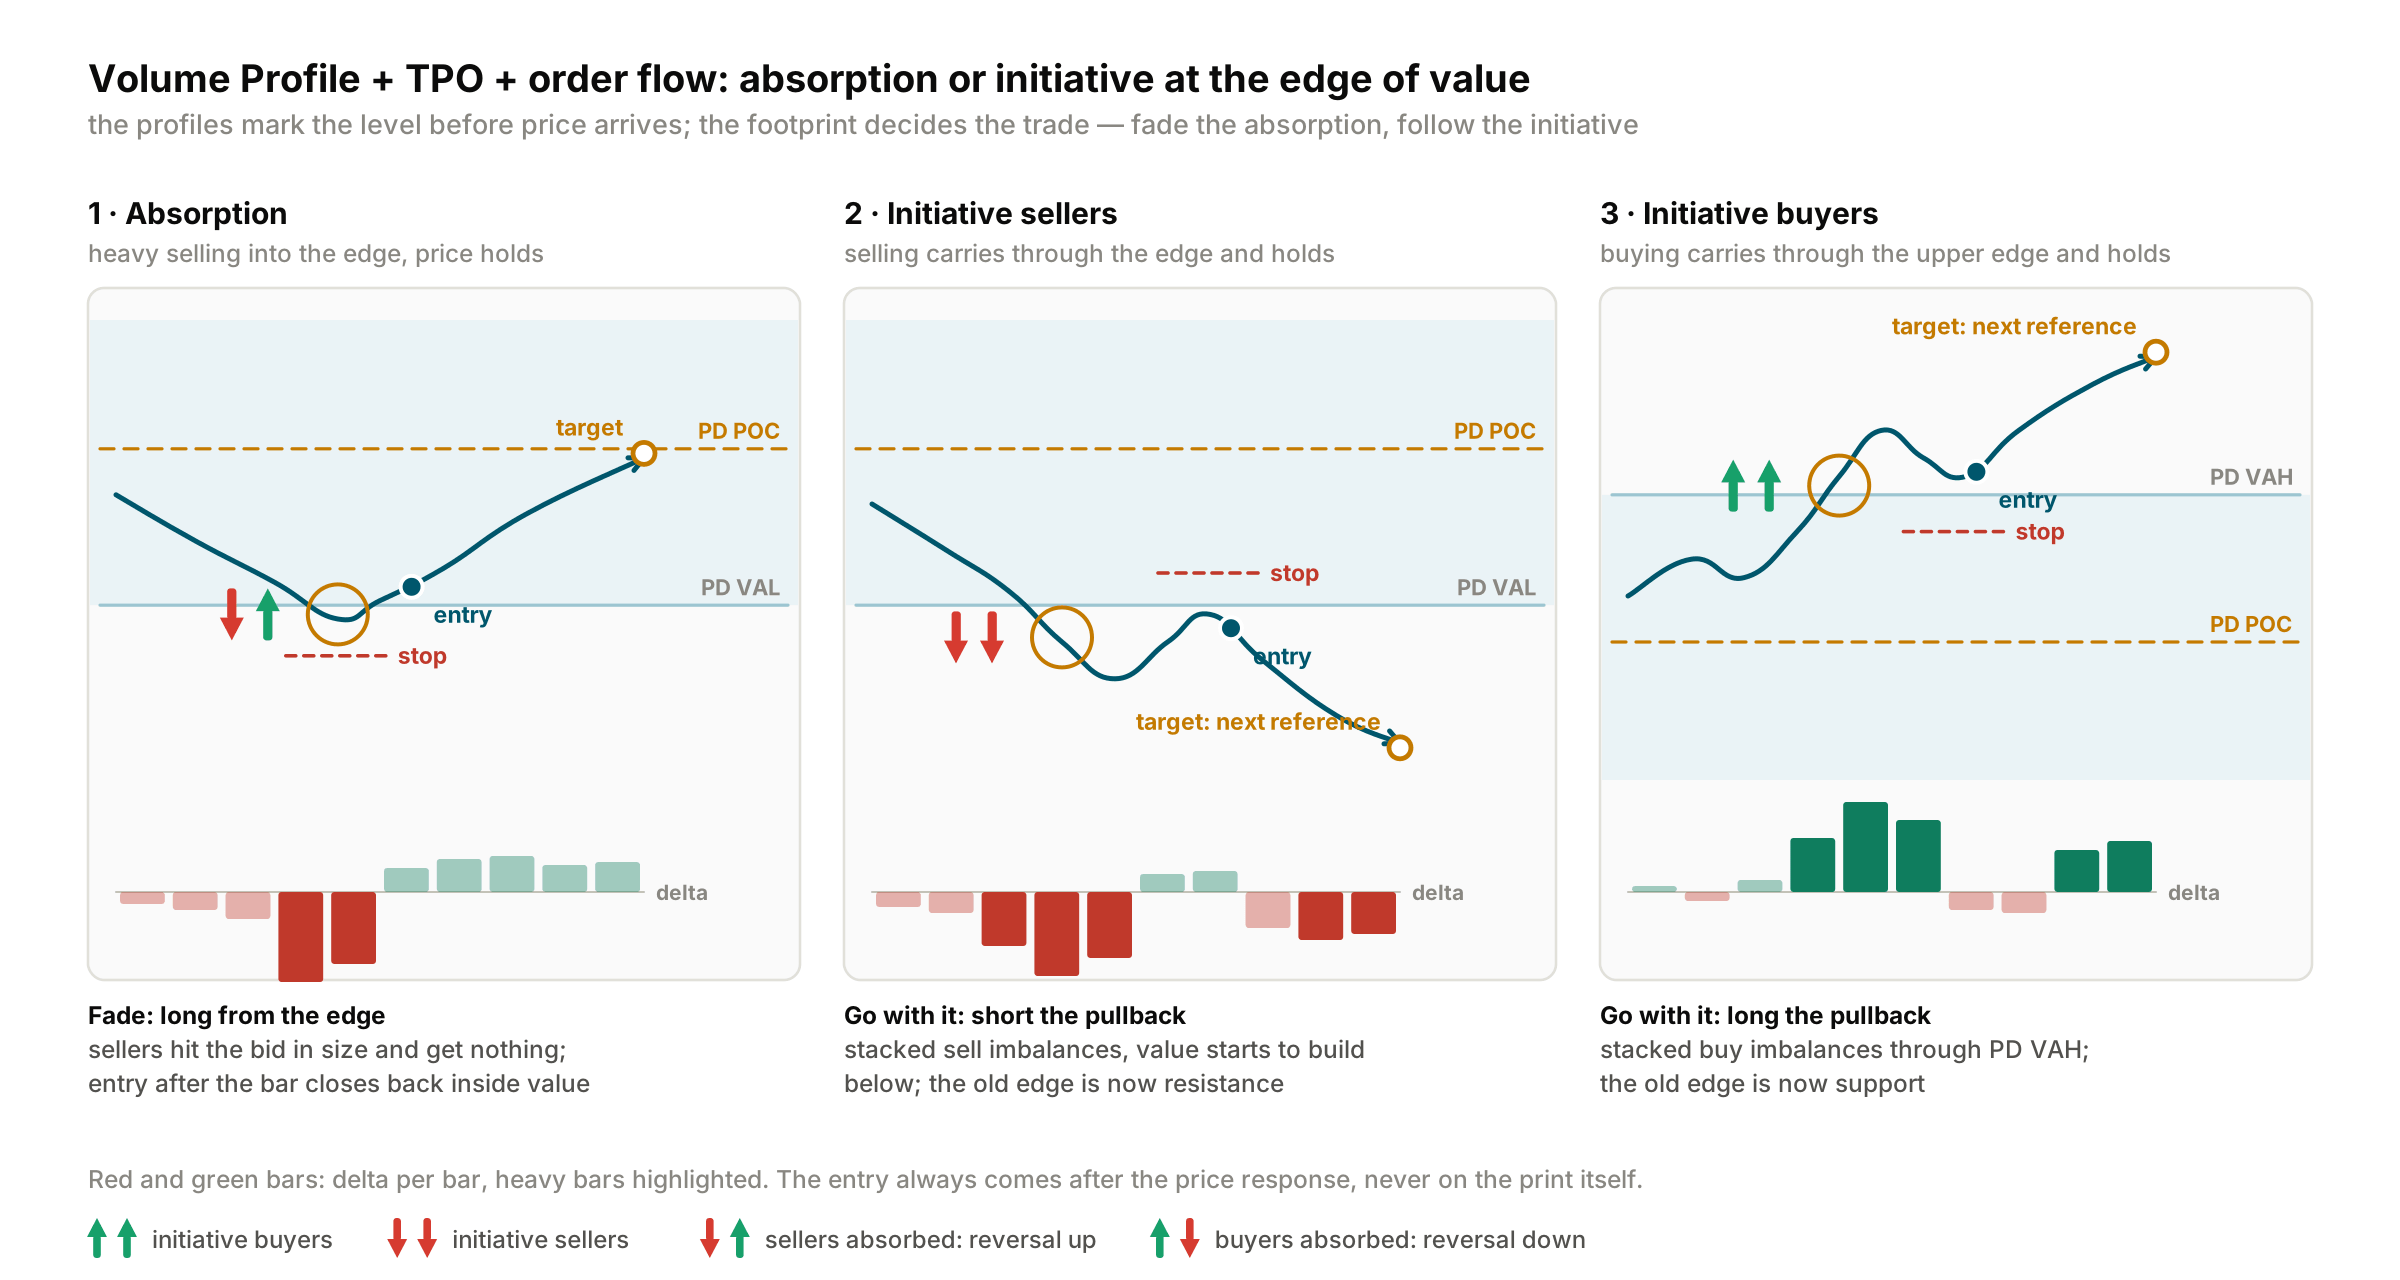
Absorption supports a fade, as a balanced day suggests. Initiative means the opposite: skip the fade and trade the pullback in the direction of the break. Each variant below has an entry, a stop, a target and an invalidation, the event that cancels the trade before the stop is hit. When it happens, exit.
| Absorption (fade) | Initiative (go with the break) |
Condition | Balance day. Selling into the level marked before the open grows (volume up, delta % strongly negative), yet price holds | Imbalances stack through the level, delta % is strong in the direction of the break, the next bars stay beyond |
Entry | After the bar closes off its extreme and the next bar holds with delta flipped | On the pullback to the broken level, once it holds |
Stop | Beyond the extreme of the absorption bar | Back inside value, beyond the pullback extreme |
Target | Just before the PD POC; then the opposite edge of value | Just before the next reference beyond: PD High or Low, a naked POC, the next high-volume node |
Invalidated when | A bar closes beyond the level with stacked imbalances on the sellers’ side | Price is accepted back inside value through the level, and delta turns against the break |
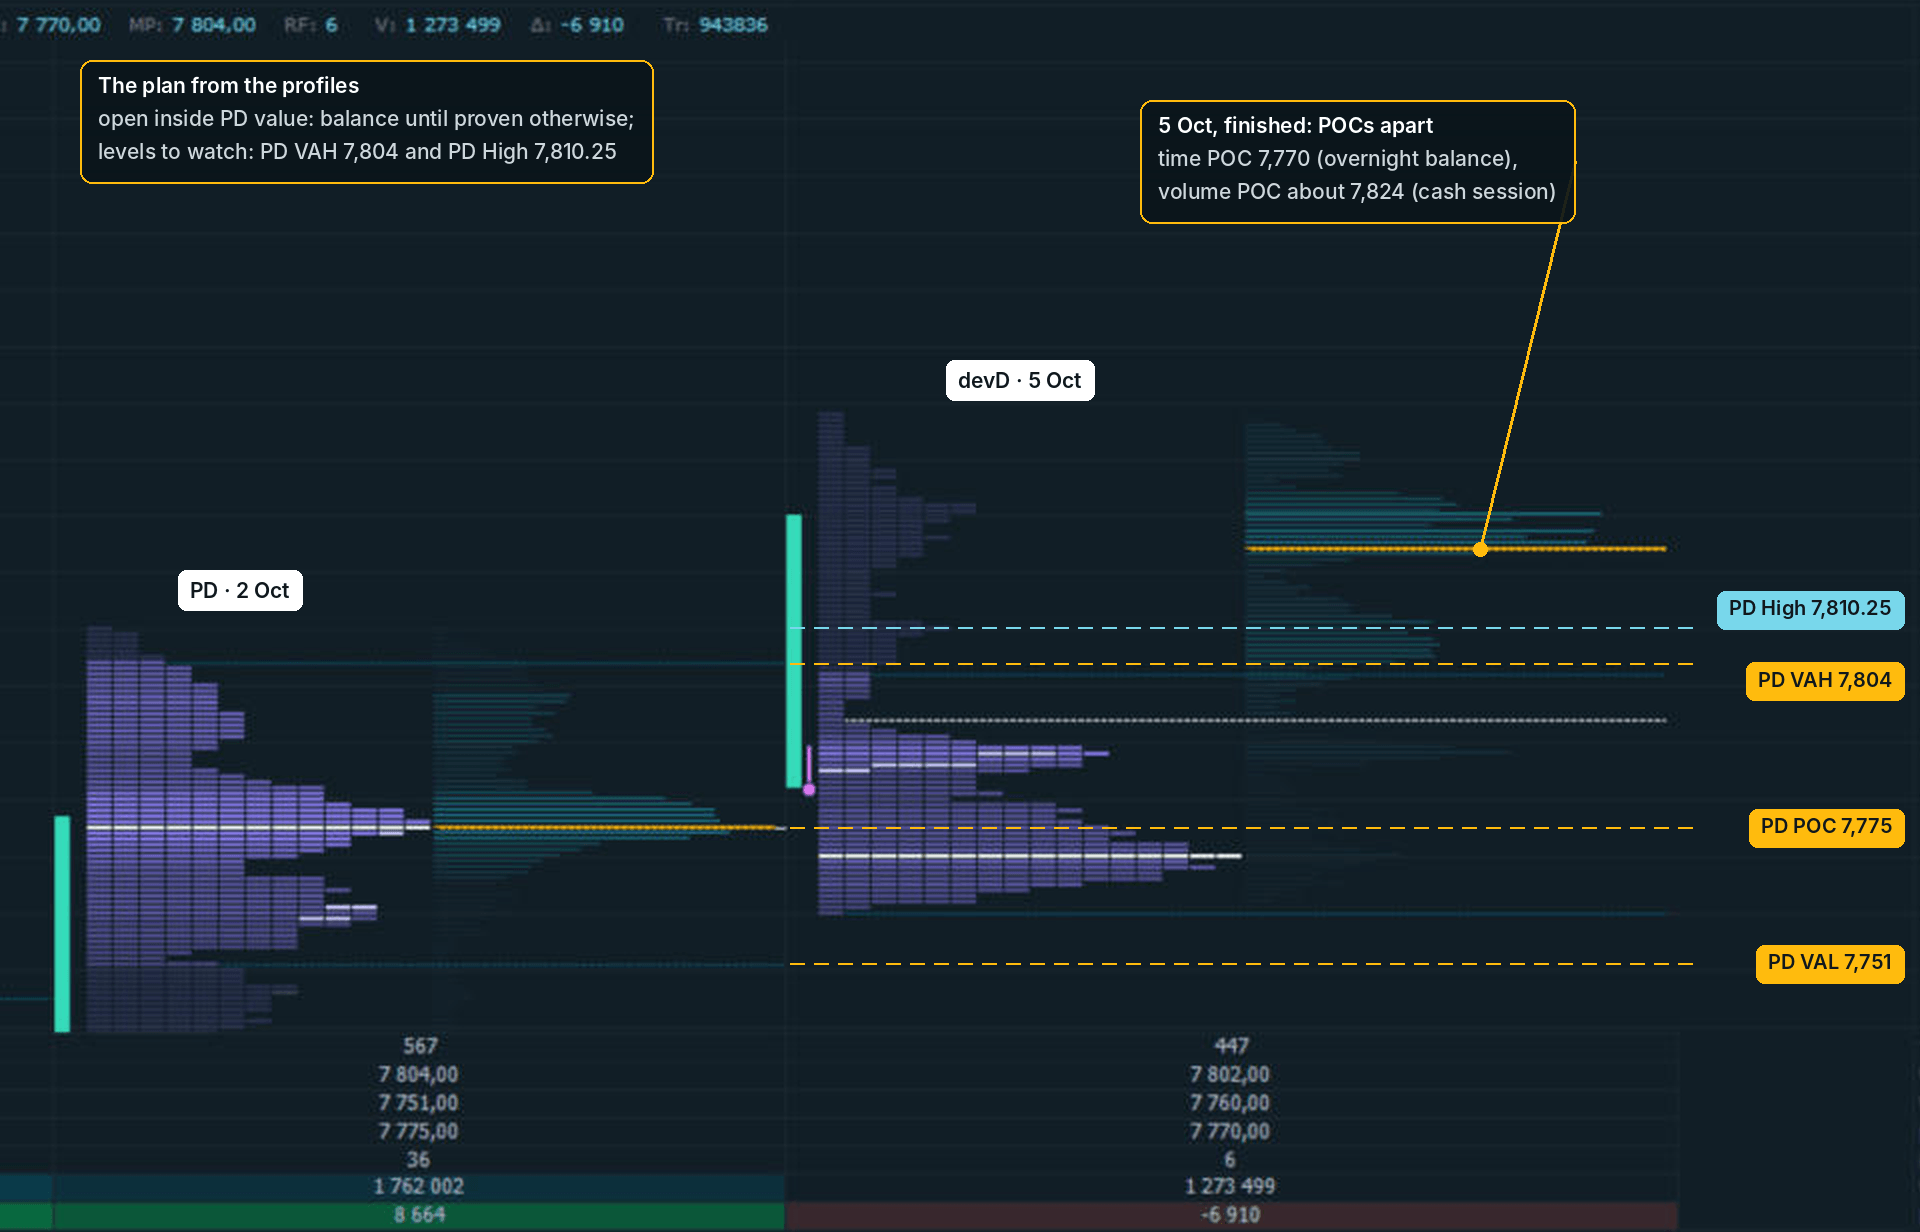
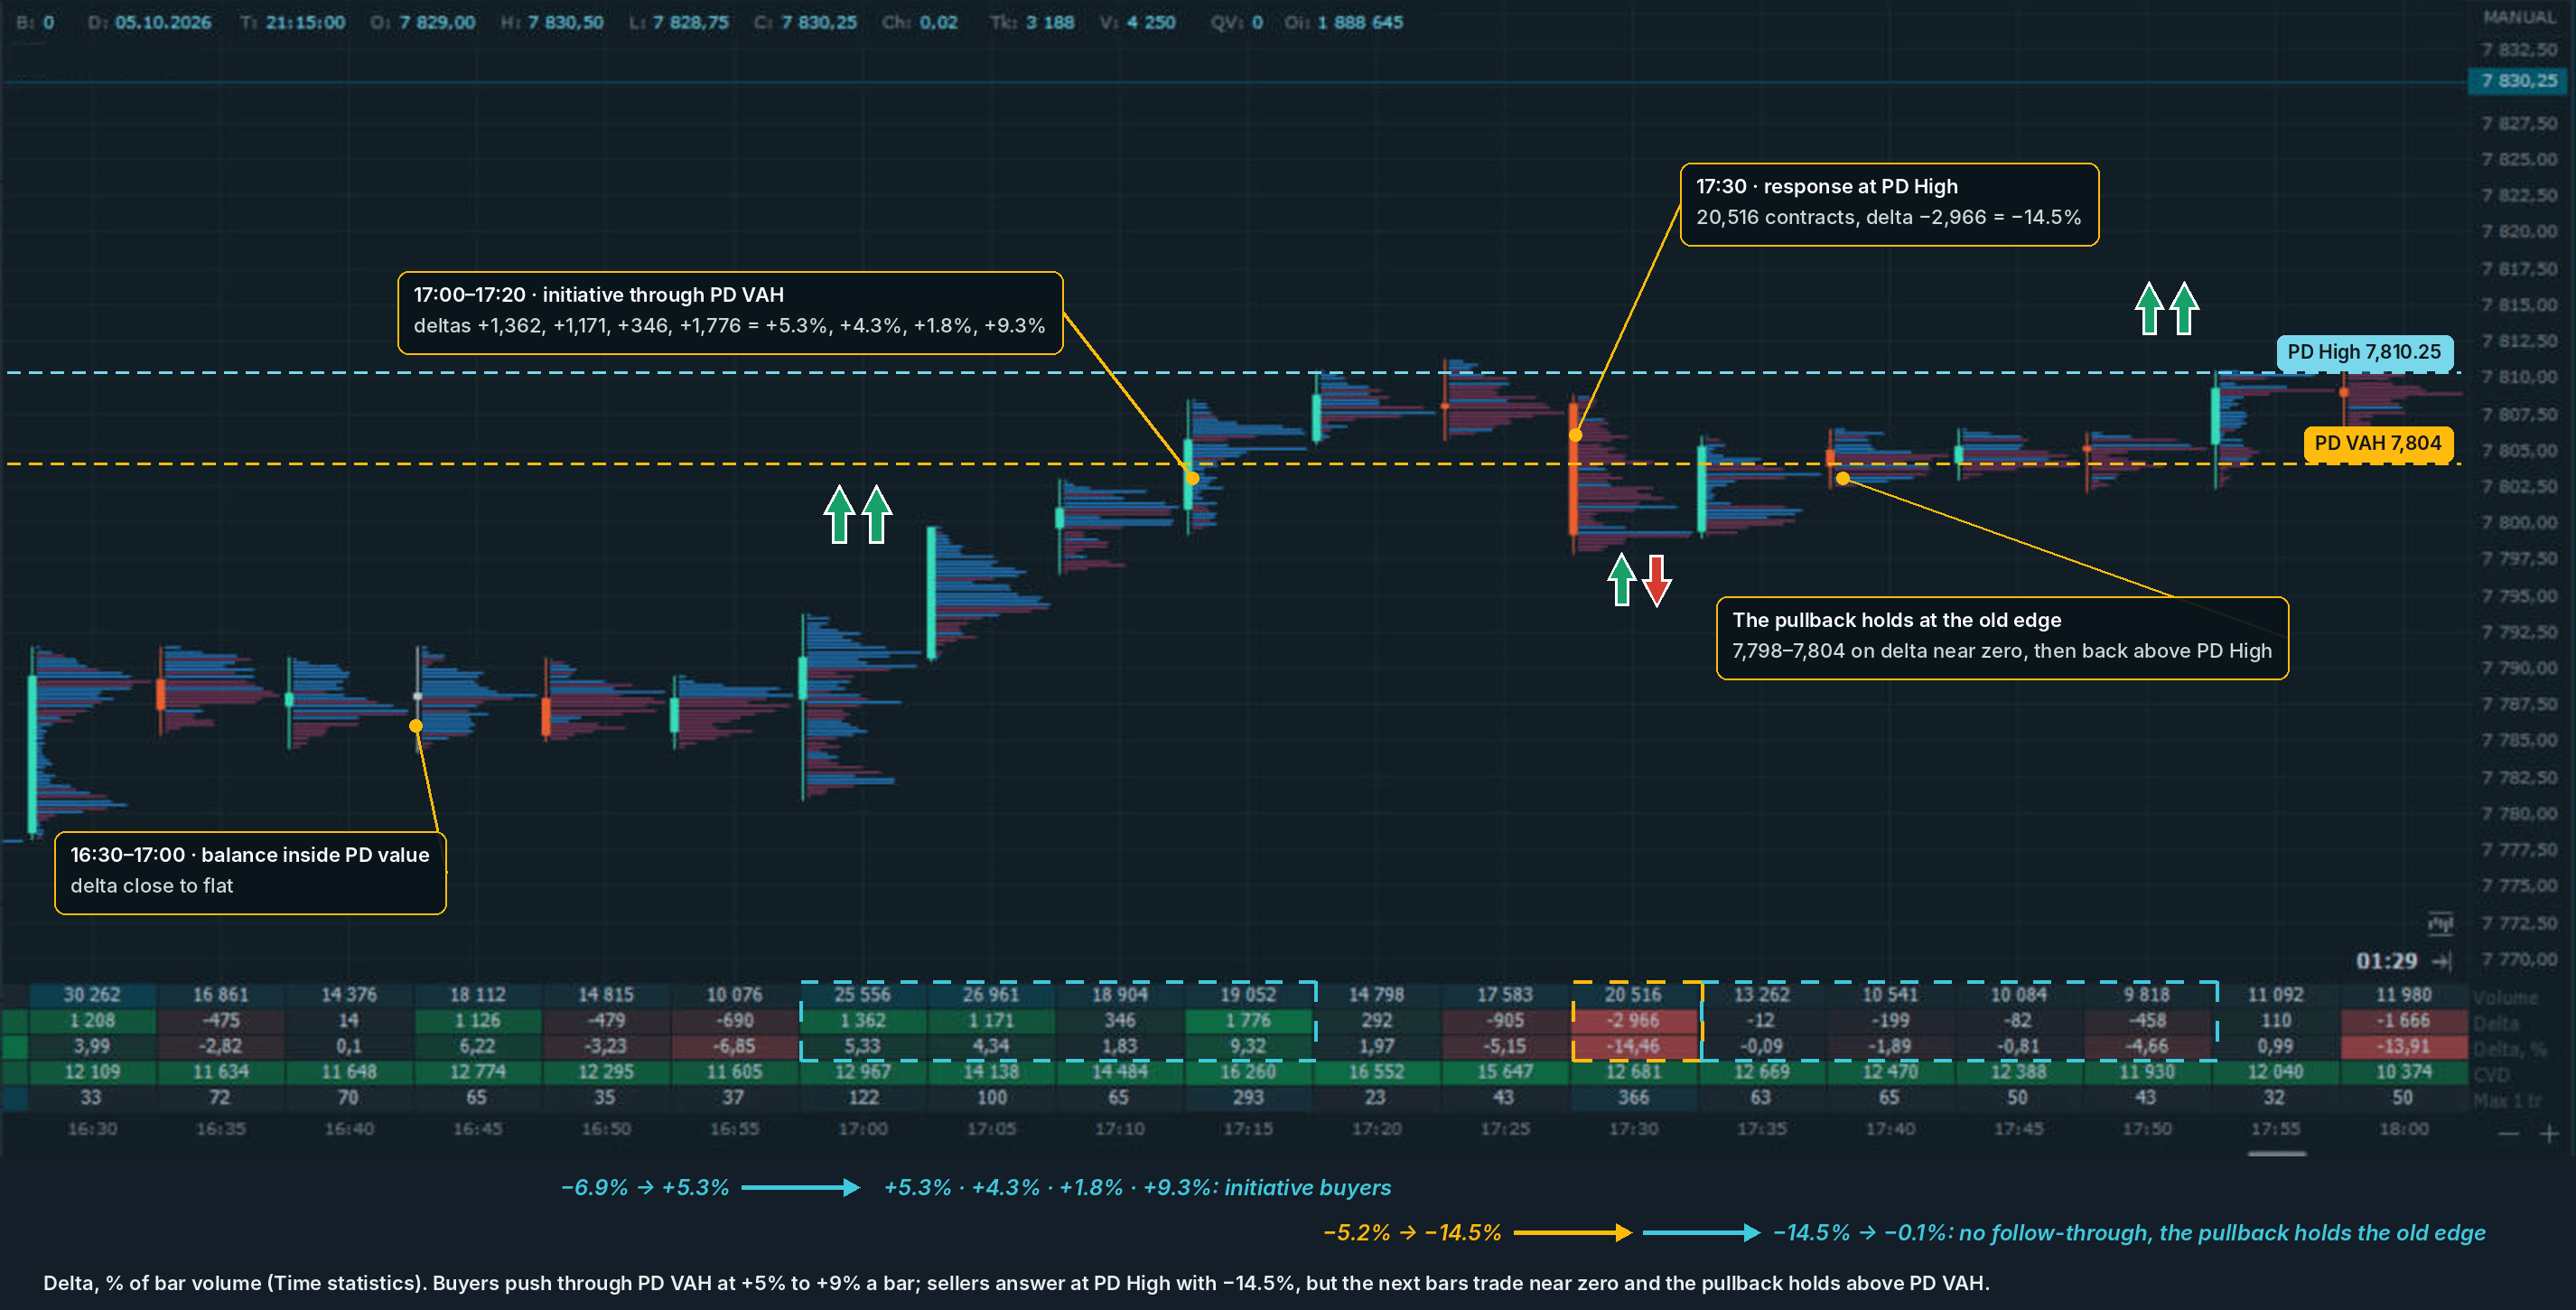
On 5 October 2026 the December E-mini S&P 500 showed initiative. The previous day had both POCs together at 7,775, in the middle of value (7,751–7,804): a balance day, so the plan was to fade the edges, with the PD VAH and the PD High (7,810.25) as the levels. The session opened inside PD value and stayed there overnight. At the cash open buyers pushed through the PD VAH: four 5-minute bars with delta +1,362, +1,171, +346 and +1,776. Sellers responded at the PD High with one bar of 20,516 contracts and delta −2,966. The pullback stopped at the old edge, 7,798–7,804, and price went back above the PD High. There was no fade; the trade was buying the pullback.
Volume Profile + VWAP + Order Flow
VWAP is the session’s volume-weighted average price. Price above VWAP means the average buyer of the day is in profit; below it, the average seller. VWAP is the institutional execution benchmark, so size tends to work around it. The standard-deviation bands show how far price is from the average.
A profile level stays fixed; VWAP moves with the session. The slope of VWAP and the side price stays on give the bias; the PD levels show where to test it.
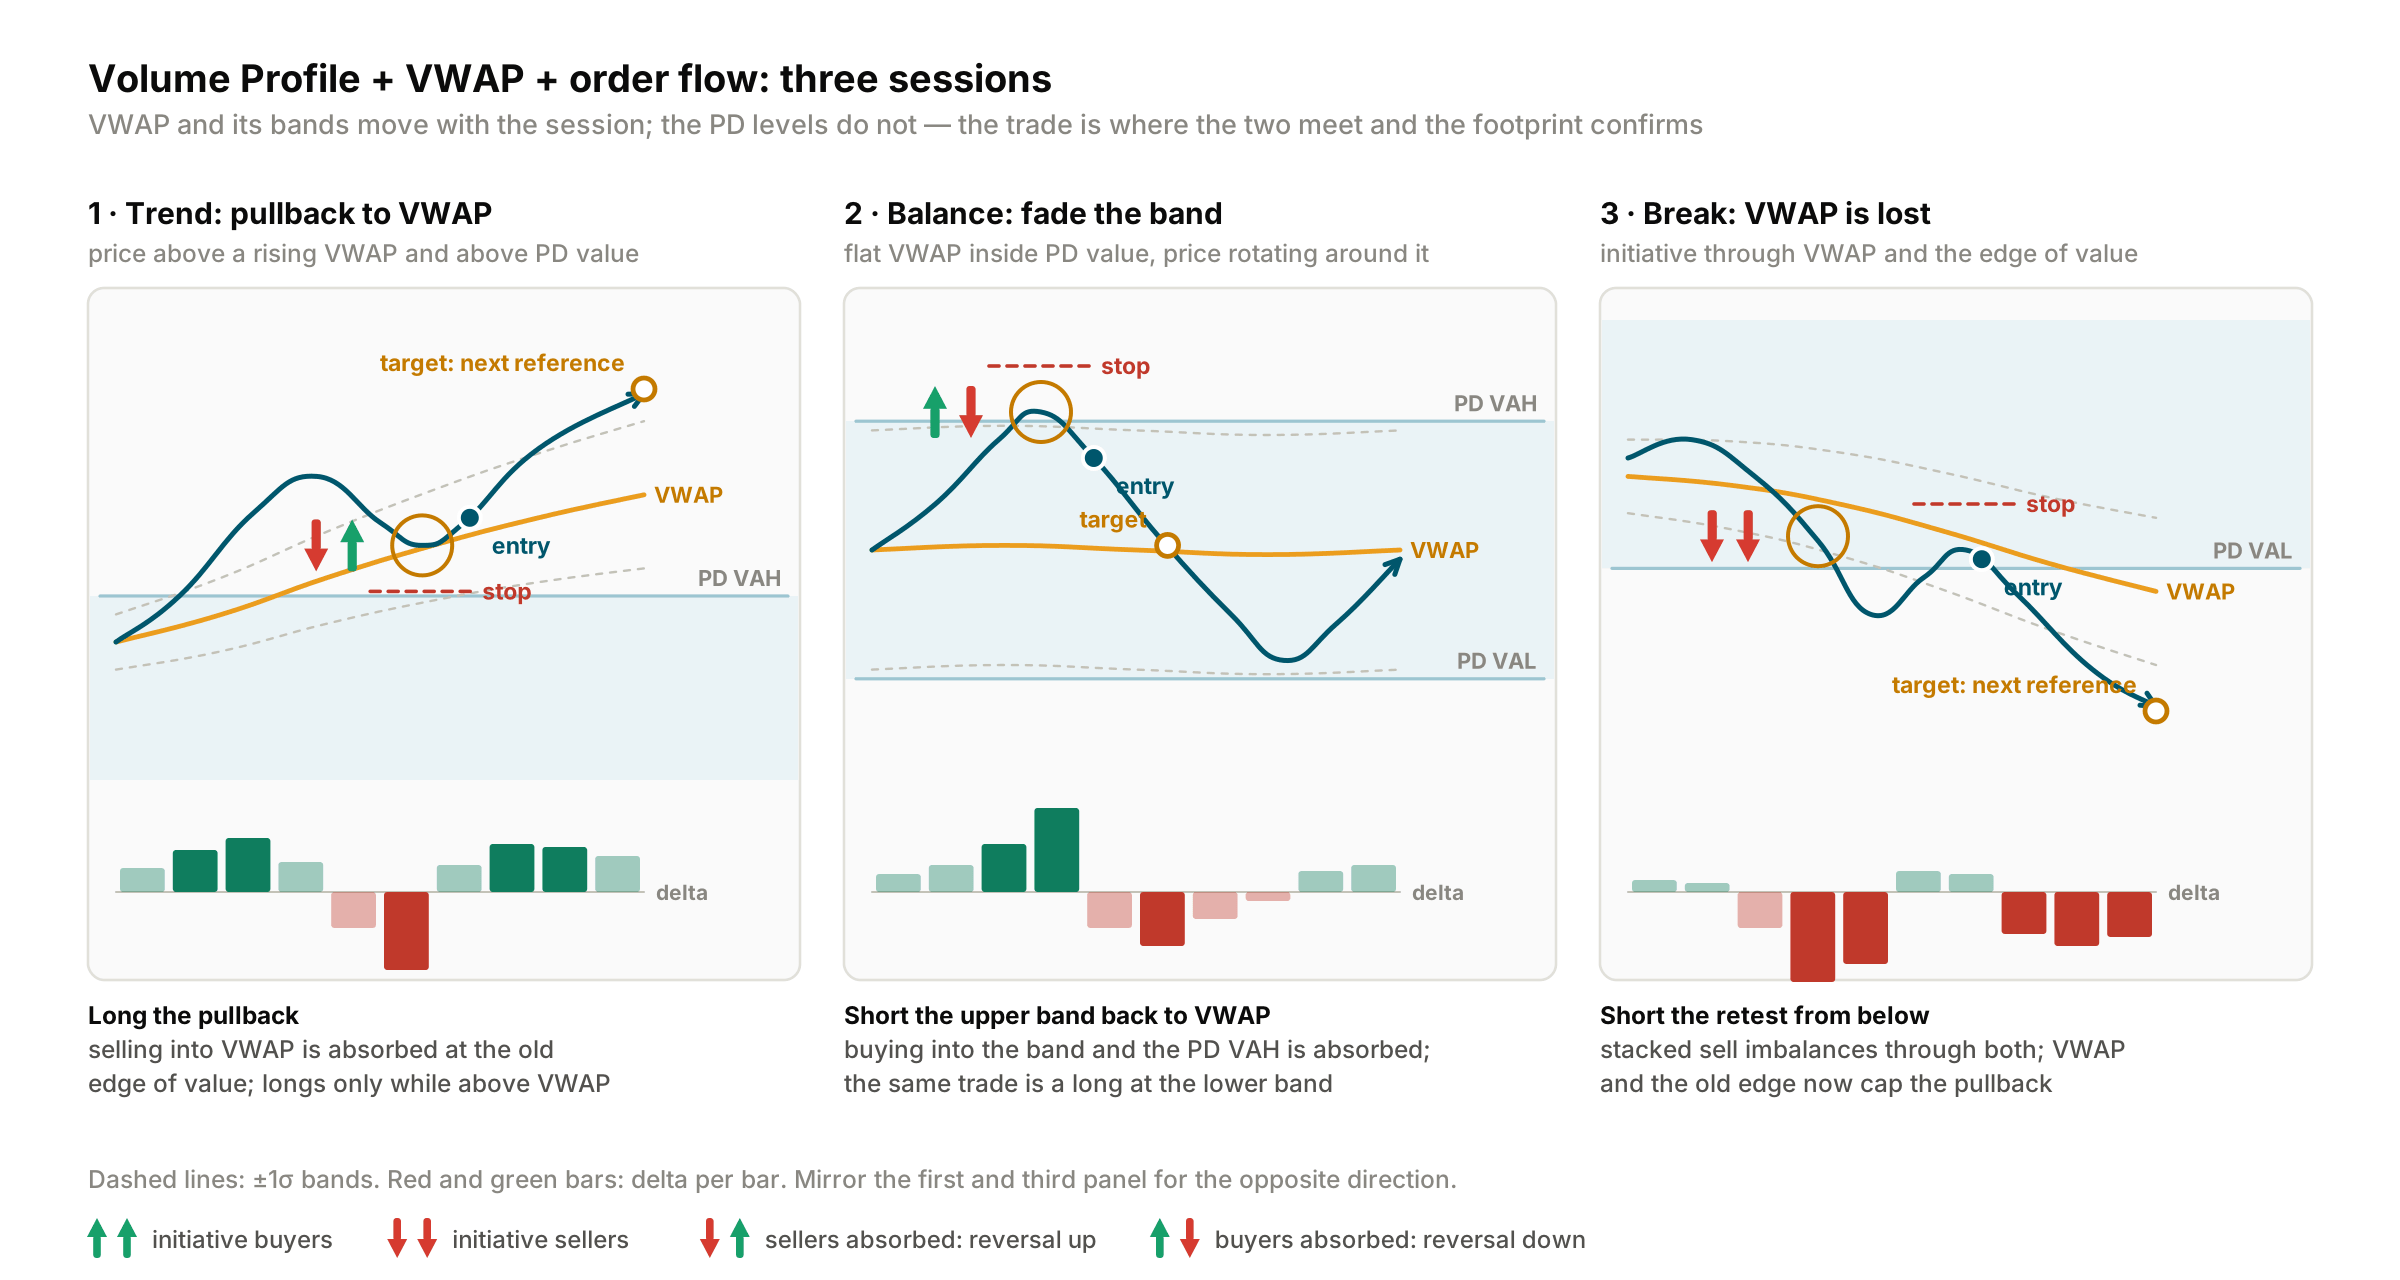
First read the regime. Flat VWAP, narrow bands: balance. Fade the bands back to VWAP. Rising or falling VWAP, widening bands: trend. Trade pullbacks to VWAP in the direction of the trend and do not fade the bands. Price loses VWAP and an edge of value together on initiative flow: the bias has flipped. Trade the retest from the other side. Use the footprint as the trigger: at VWAP the reaction takes minutes, and a half-hour close is too slow.
| Trend pullback | Balance band fade | VWAP lost, retest |
Condition | VWAP sloped, bands widening, price holds one side. A pullback to VWAP where it meets a profile level | VWAP flat inside PD value, bands narrow. Price at a band at an edge of value | Price loses VWAP and an edge of value together on stacked imbalances |
Entry | Absorption on the footprint at VWAP | Absorption at the band: buying expands, no upside progress | On the retest of VWAP from the other side, when it fails |
Stop | Beyond the pullback extreme, on the other side of VWAP and the level | Beyond the extreme at the band, outside value | Back across VWAP and the edge of value |
Target | Just before the session extreme or the next profile reference | Just before VWAP or the devD POC | Just before the next profile reference: PD POC, the opposite edge, a naked POC |
Invalidated when | A close on the other side of VWAP on initiative flow; VWAP flattens | The bands start to widen and VWAP turns toward the probe; acceptance outside value | Price reclaims VWAP and holds; value builds back on the old side |
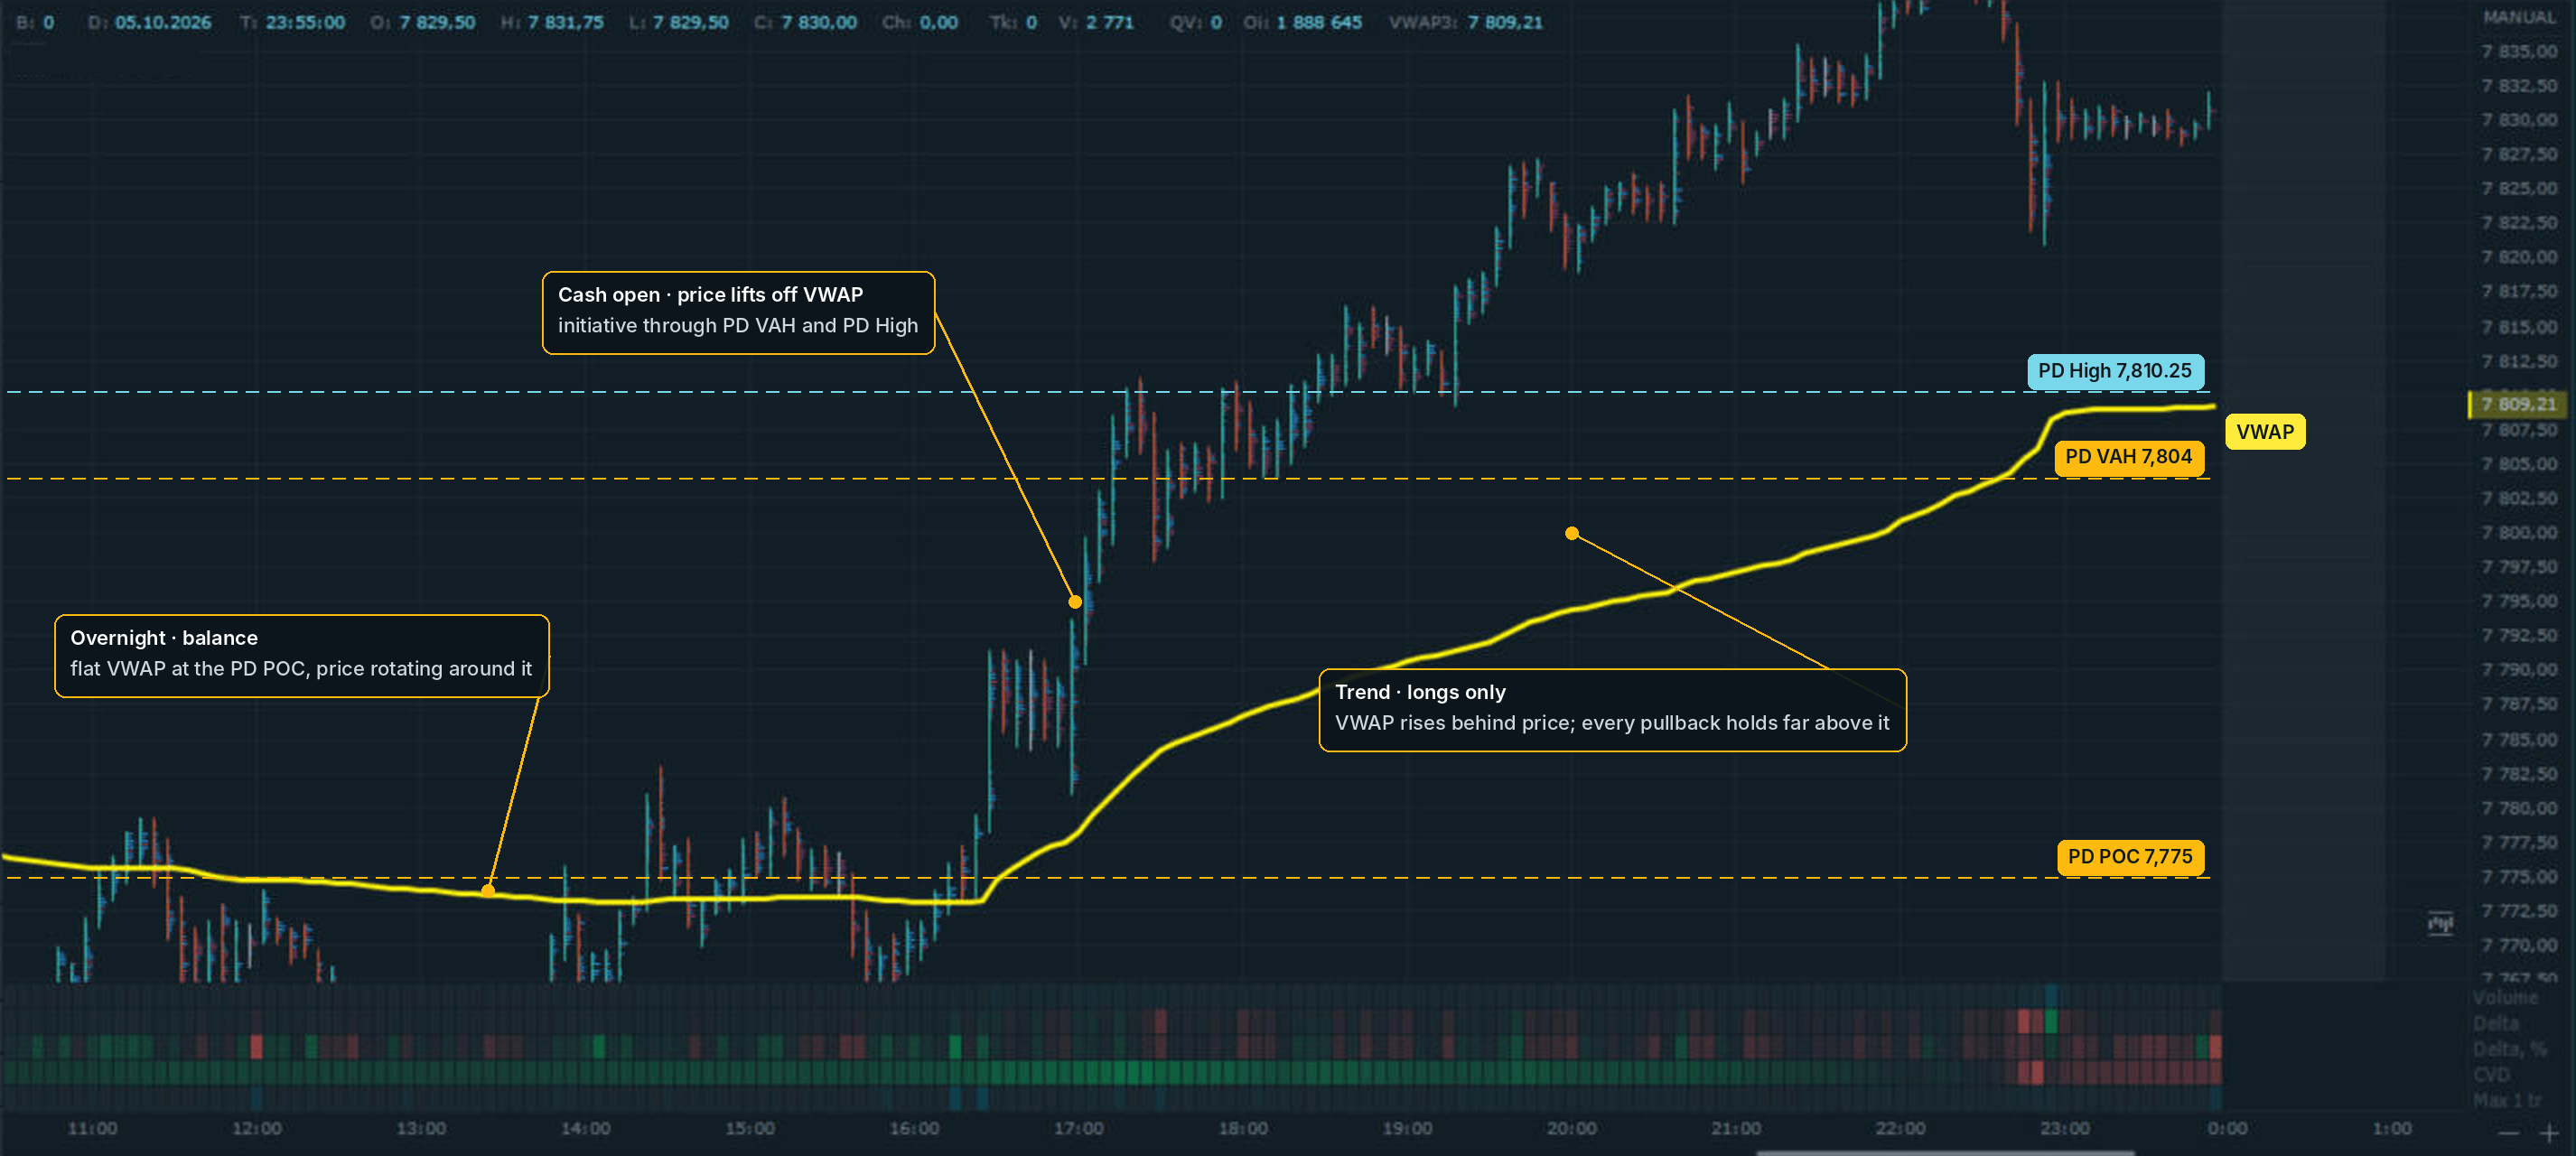
The 5 October session shows two of the three states. Overnight, VWAP was flat at the PD POC and price moved around it: balance. At the cash open price broke away from VWAP, through the PD VAH and the PD High, and VWAP turned up. From then on the bias was long only, and price never revisited the line. The entries were at the PD levels, as in combination 1; VWAP gave the direction.
An anchored VWAP starts at a bar you choose (a swing high or low, a breakout, a news release) and shows who is in profit since then. In Quantower, VWAP on the Volume Analysis toolbar is the session line; CUSTOM VWAP is the anchored one.
Risk Management and Trade Exits
Place the stop where the trade thesis is invalidated: beyond the high or low of the reaction. Size the position off the stop distance, never the other way around. Use the volume map for both. A high-volume node or a POC is a barrier: price slows down there. Set the target just in front of the next barrier, not on it. Set the stop behind one, so that price has to break through it first; a stop in a low-volume area in front of a level is easy to run. If the first target does not pay at least the risk (1:1), pass.
Exit on invalidation, even if the stop has not been hit. Two examples: price breaks out, but value does not follow; or a fade is on, but value starts to build beyond the level. No setup here comes with a win rate; that number comes from your own trade journal.
Pre-entry Checklist
Five questions before every entry. A “no” on any of them means no trade.
Check | Question |
1. Context | Where did the session open against PD value and the PD range? Is the day in balance or out of it, and which side does the plan favor? |
2. Location | Is price at a level marked before it arrived: the PD POC, an edge of PD value, PD High or Low, a naked POC, or VWAP and its band at one of these? |
3. Regime | Is VWAP flat or sloped, are the bands narrow or widening? Does the setup fit: a fade in balance, a pullback in a trend? |
4. Trigger | Did the footprint show absorption or initiative at the level, and did price respond? |
5. Plan | Is the stop behind a high-volume level and the target just before the next one? Is the invalidation written down? Does the first target pay at least the risk? |
Volume Profile Trading FAQ
What does it mean when the two POCs diverge?
Most volume traded at one price, most time was spent at another. If the volume POC is on the side of the day’s move, it supports the move; if it is left behind, the next session tests it.
What is a naked POC?
A POC that price has not traded back to since its session closed. It is used as a target and as a reaction level on the first return.
How is VWAP used with Volume Profile?
The profile gives fixed levels and VWAP a moving one. The best place to trade is where they meet, for example a pullback to VWAP at an edge of value, with the footprint as the trigger.
Is order flow required to trade Volume Profile?
No. The profile gives the level, and the price reaction there gives the timing. The footprint shows the same reaction earlier.

Comments