Using VWAP and breakeven orders inside the DOM
Navigation
Explore the newest release of the Quantower terminal that boasts an array of cutting-edge functionalities aimed at improving your trading and data analysis experience. In this brief summary, we'll take a closer look at a few of these features and help elevate your trading skills to greater heights.
Customize your Chart space with new margin settings
You can now adjust the distance of the chart from the top, bottom, and right edges of the chart window with the Top Margin, Bottom Margin, and Right Margin options in the chart settings.
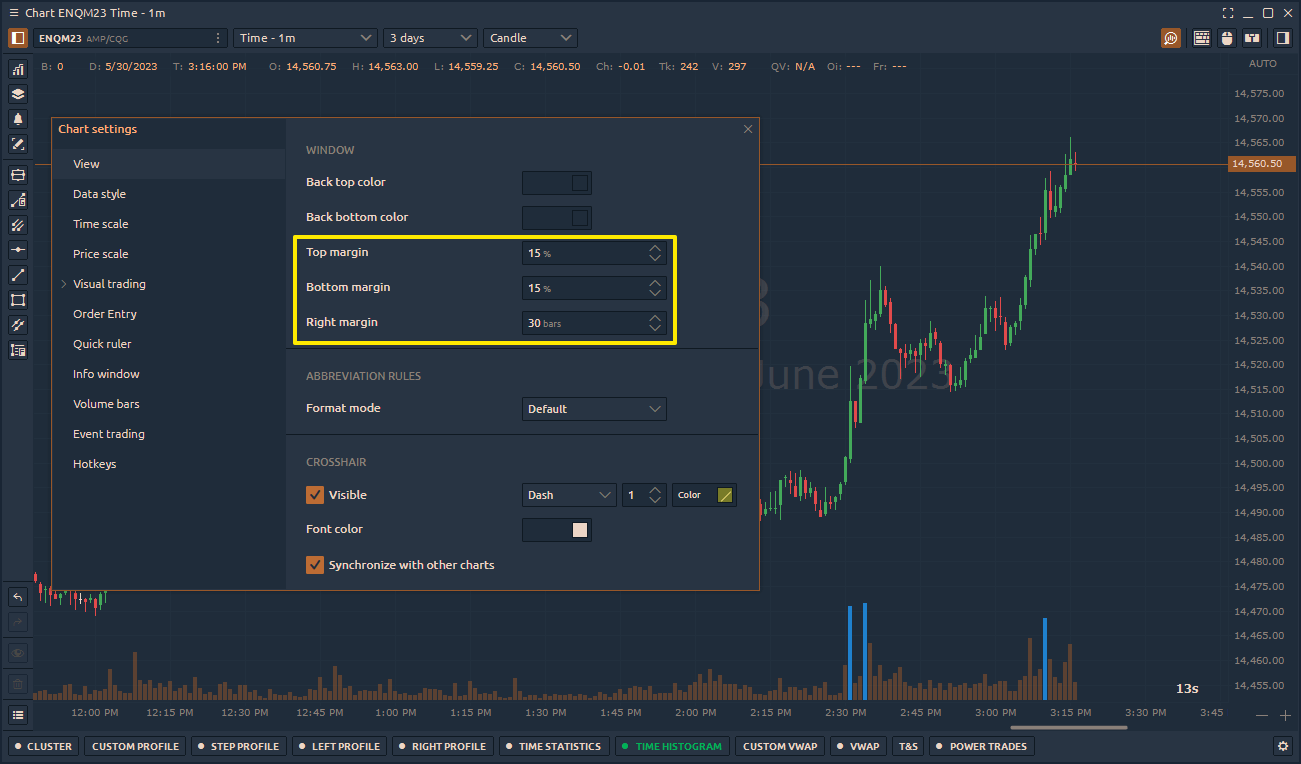
If you require more space for your indicators or a broader view of the chart, the updated margin settings will improve your trading experience. You can easily modify your chart's margins to achieve the ideal combination of visibility and functionality.
VWAP value in the DOM Trader panel and other improvements
The VWAP indicator is an extremely useful tool for successful trading that can be used on Quantower charts to determine support and resistance zones. However, if you frequently use the DOM Trader panel in your trading, you can now conveniently see the VWAP indicator value right on the DOM price scale.
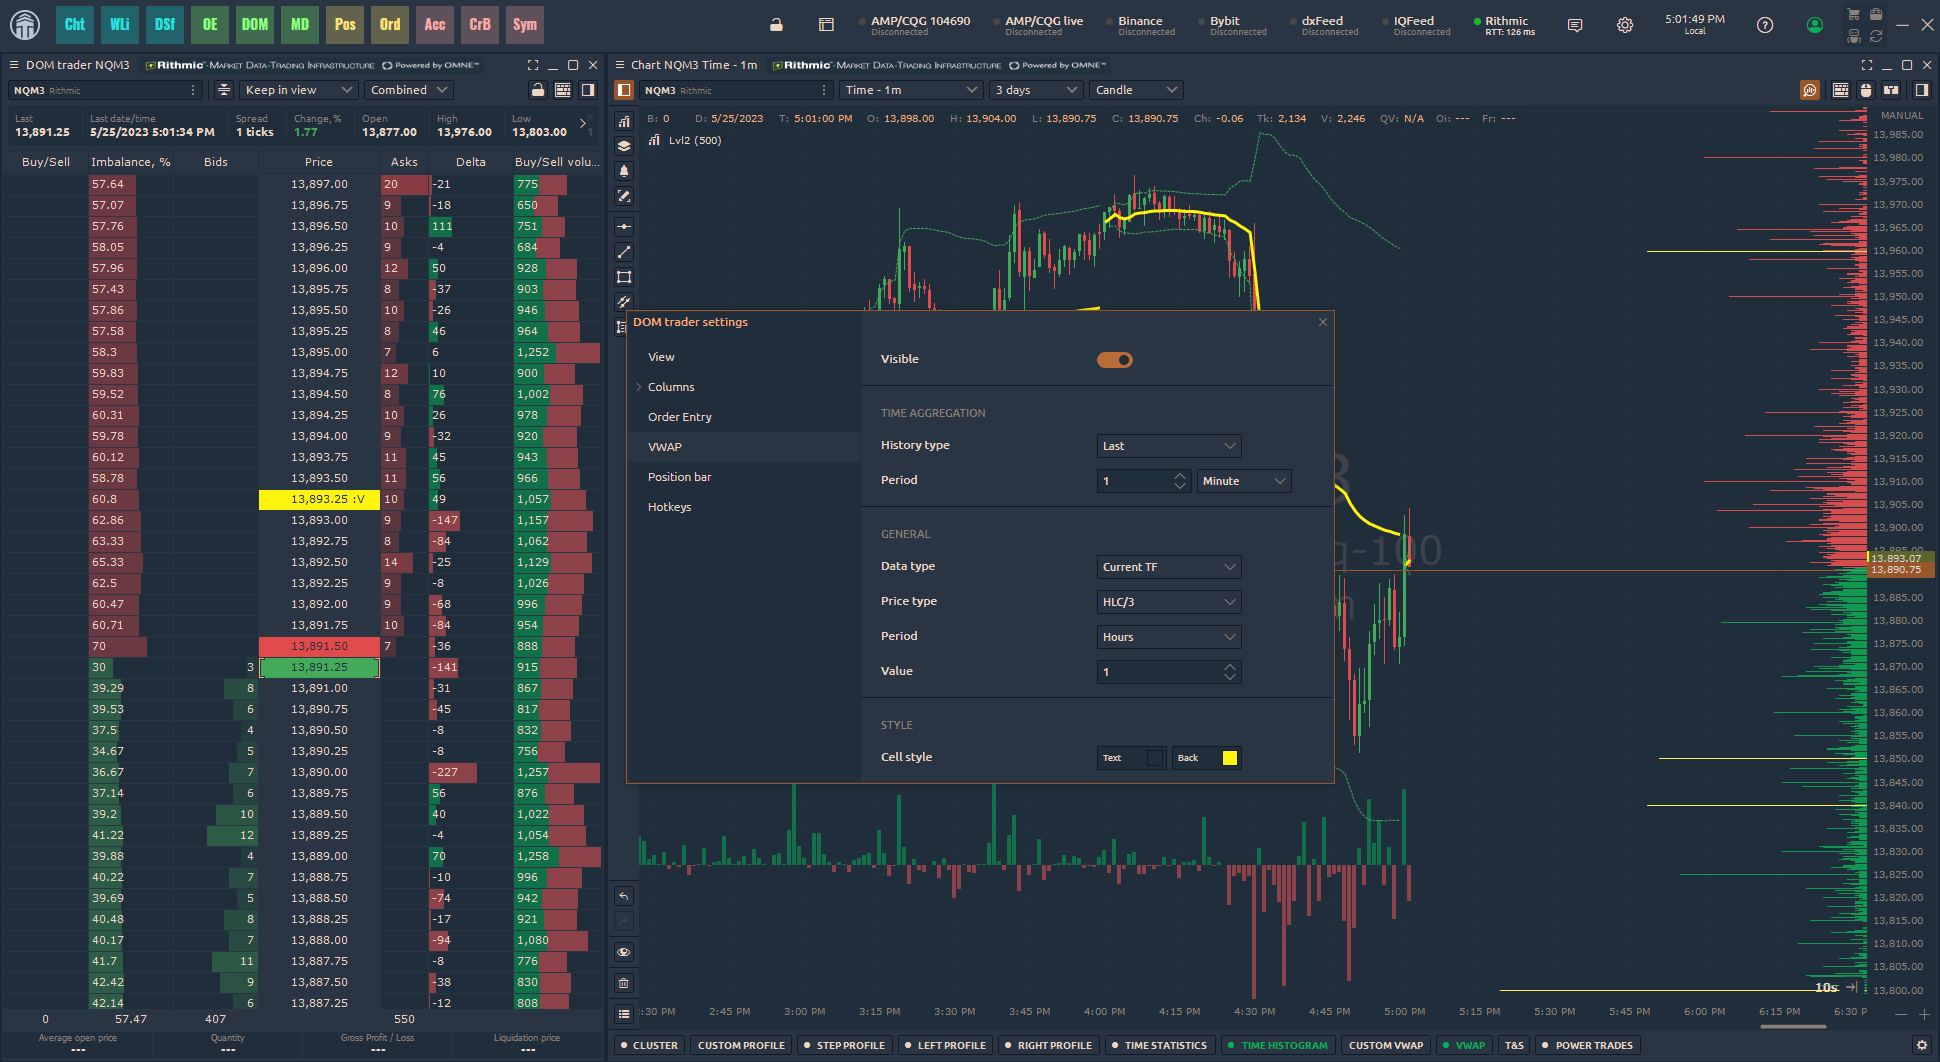
To activate it, go to the DOM Trader settings, and in the VWAP section, select the required data type, calculation period (hour, day, etc.), and display style.
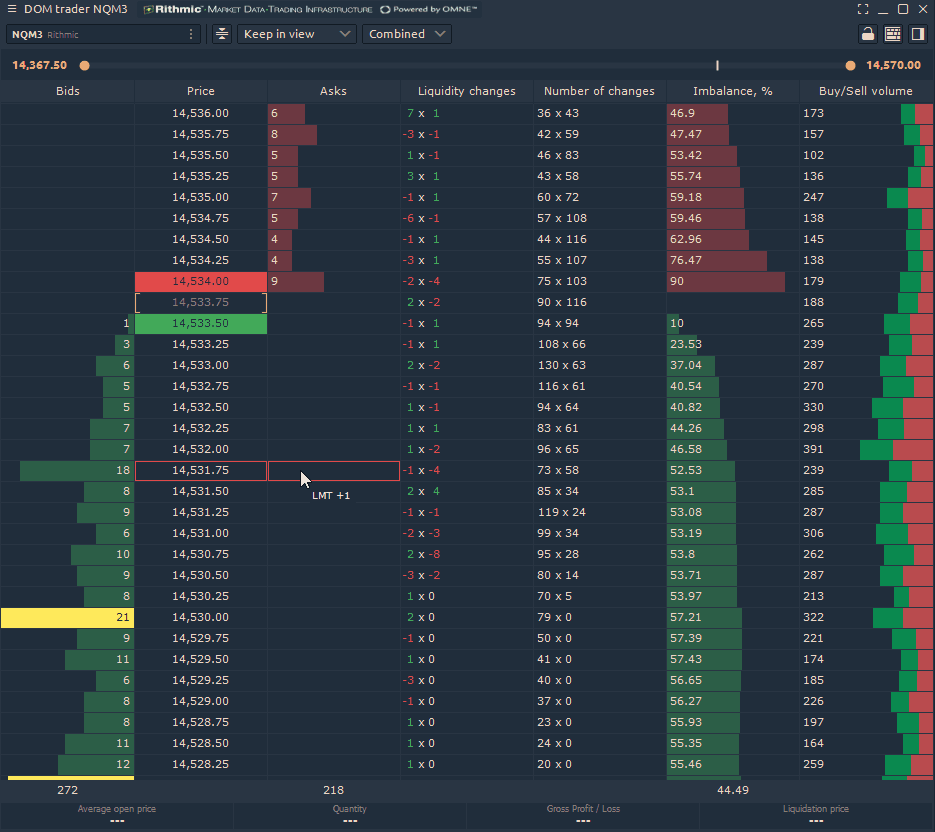
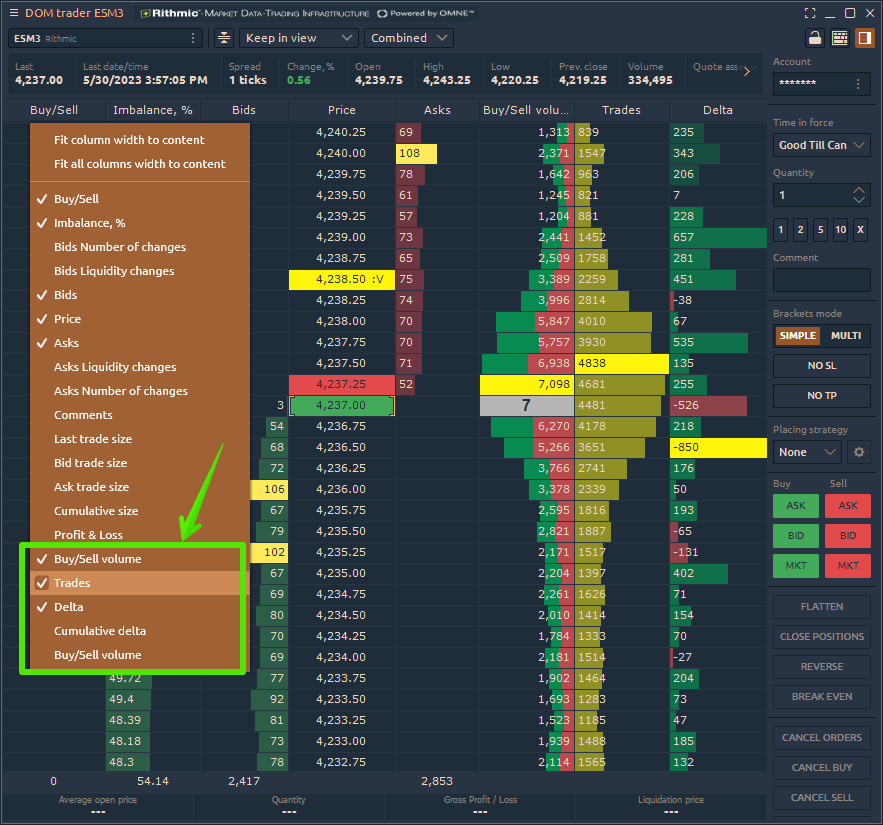
Splitting Liquidity Changes and Number of Changes
In Quantower, you can now split values in the Liquidity Changes and Number of Changes columns. This new feature makes it easier to compare and analyze data by displaying separated columns next to the corresponding Bid and Offer sides. To enable the feature, right-click on the column and select "Split column".
Added more volume profile columns into DOM Trader
The volume profiles show the price levels at which trades happened, along with their corresponding volumes. The levels with the highest volume are called the Point of Control (POC), and they are important support and resistance levels. The DOM Trader panel has multiple columns of volume profiles, which allow you to choose different types of data for a more detailed and thorough analysis, including Delta, Buy/Sell, and Number of Trades. Moreover, you can set different sessions for different profile columns. For example, you can simultaneously monitor the accumulation of the daily volume profile and a specific trading session, such as Regular Trading Hours (RTH).
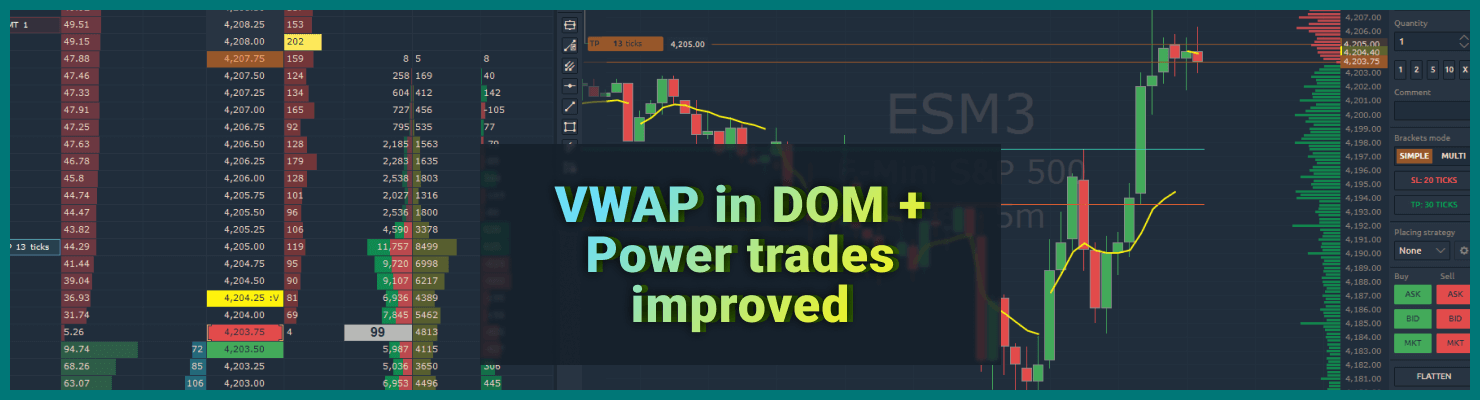
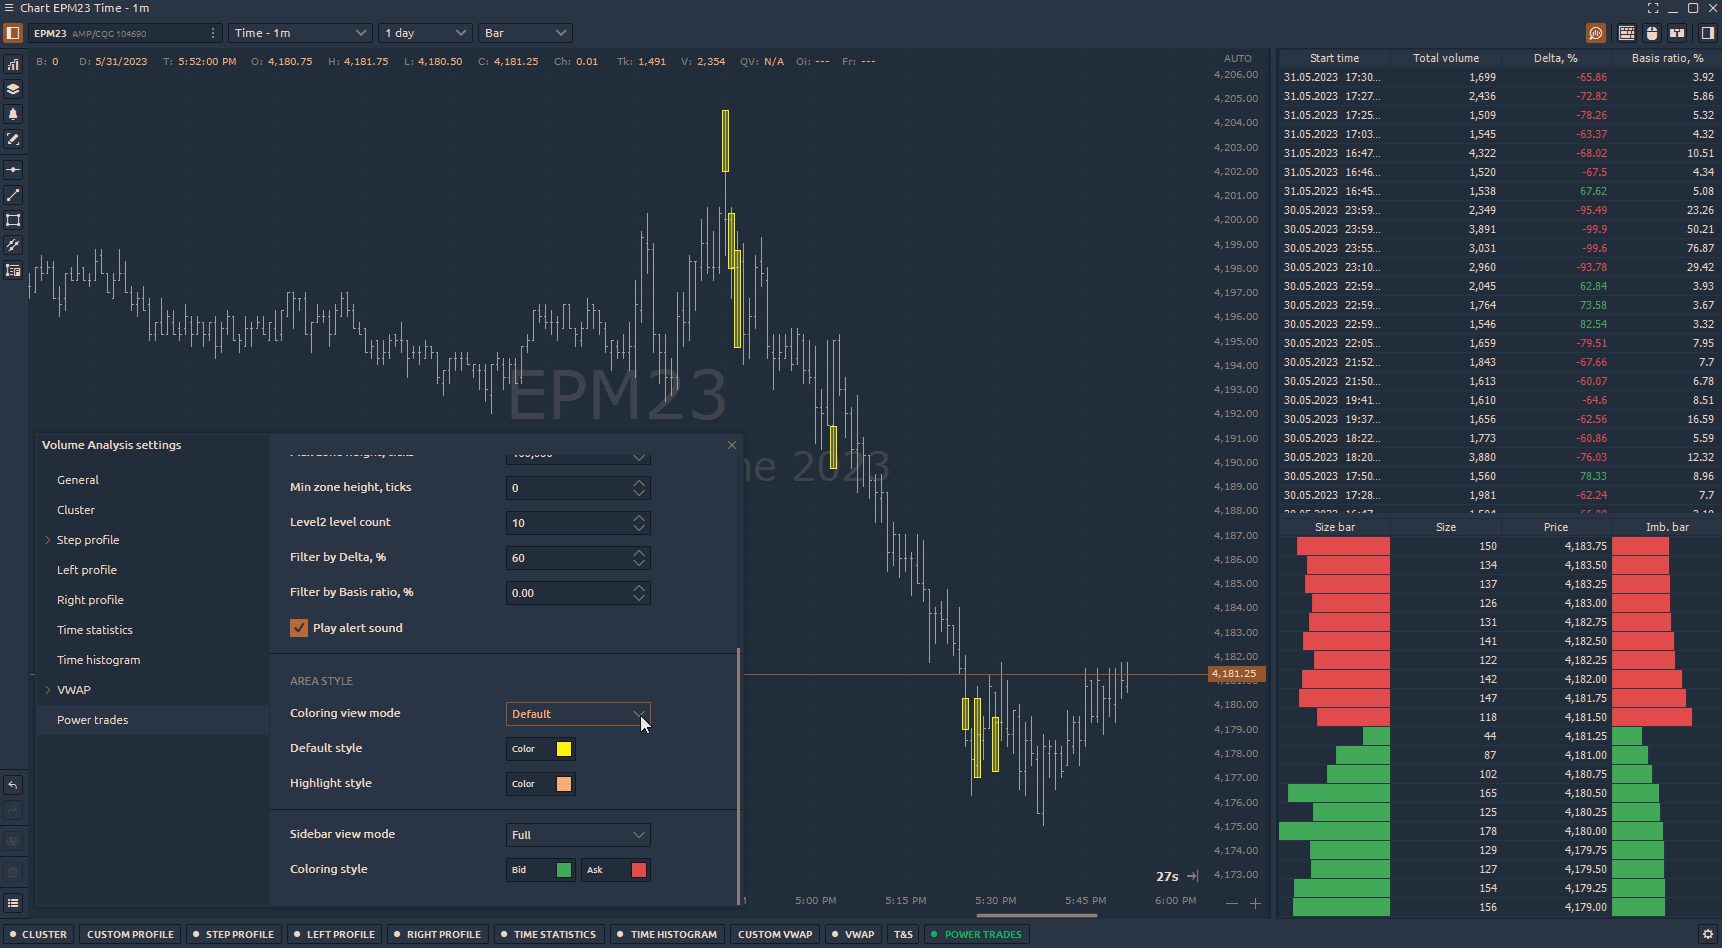
Power Trades got new colors
We've made some improvements to Power Trades Zones by adding two new color modes that allow you to color the zones based on volume delta. This means you can now easily visualize the difference between buy and sell volumes in a particular zone. On top of that, we've also added color for filtered volume, which helps highlight zones that exceed the filter value you have set.
Improved Breakeven option for managing positions
Let's remind you that the Breakeven feature moves your protective order (Stop Loss) to the opening price of your position, making it completely risk-free. Based on feedback from many of our traders, we have added the option to move the Stop Loss to N+ ticks from the opening price of the position, covering commission costs and ensuring a minimum profit.
In the new version, traders can set Breakeven using several predefined levels. Additionally, it is possible to move Breakeven to any specified value of N+ ticks as desired.
To access this feature, simply right-click on the open position and choose "Modify SL to breakeven" from the context menu. From there, you can select the desired distance or enter your own value.
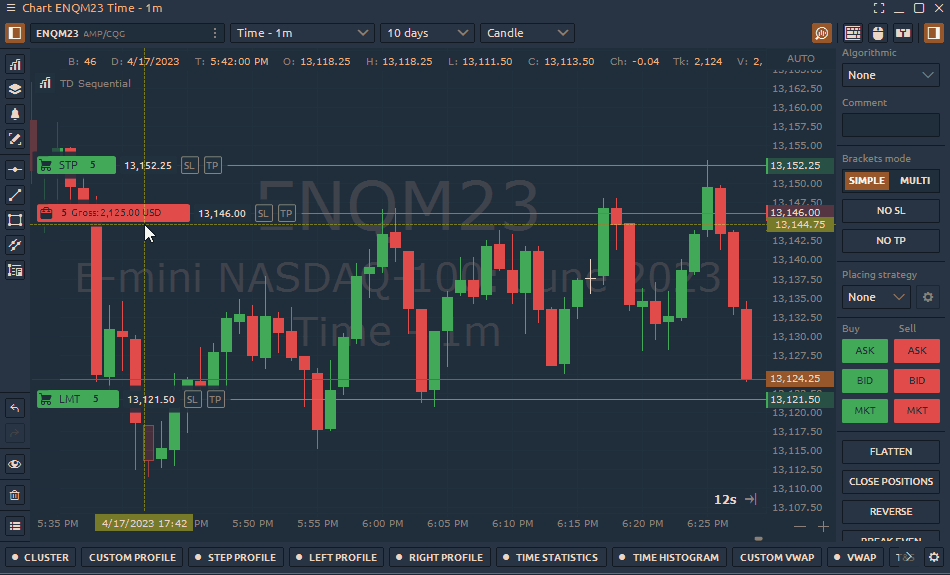
It's important to note that Breakeven cancels the TP order if it is not linked in an OCO group with the SL order. We recommend linking your SL/TP orders in an OCO group (Bracket orders) before using Breakeven or apply it only for single SL order without TP.
Check out our short video tutorial on how to create an OCO group.
We hope this new feature helps you manage your trades more effectively.
New Indicators and Improvements: Abnormal Trades, Bollinger Bands Fibonacci, Level2 indicator
Abnormal Trades
The Abnormal Trades indicator is created to swiftly identify bars on the chart and watchlist that have a significantly high number of trades.
This tool is useful for detecting areas on the chart where a large volume of trades happened during a specific time. Additionally, it can be added to the watchlist to efficiently sort and choose instruments that have a high volume of trades anytime. The selection process is based on the ratio of the number of trades on the current bar to the average number of trades over a specified time frame.
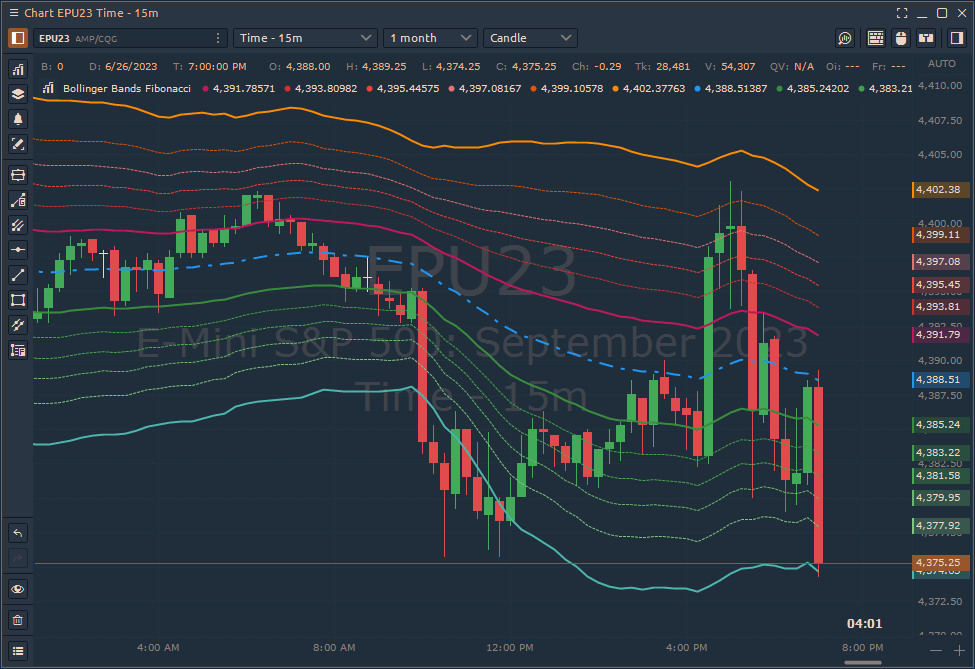
Bollinger Bands Fibonacci
Fibonacci Bands and Bollinger Bands are both indicators used to gauge price volatility, but Fibonacci Bands offer a more comprehensive perspective. Unlike Bollinger Bands, which only use one middle band, Fibonacci Bands use three upper and three lower bands, providing traders with more insight into market trends. Additionally, Fibonacci retracements are incorporated into the Bollinger Bands to clearly show areas of support and resistance.
The basis for these bands is calculated using Volume Weighted Moving Average, with the bands being set at three standard deviations away from the mean. This means that 99.73% of observations should fall within this range. Traders can use this information to fine-tune their trading systems, generate timely signals, and avoid entering trades too early or too late. Additionally, monitoring changes in volatility can help signal potential trend reversals in the stock or security being analyzed, making Fibonacci Bands a valuable tool for traders.
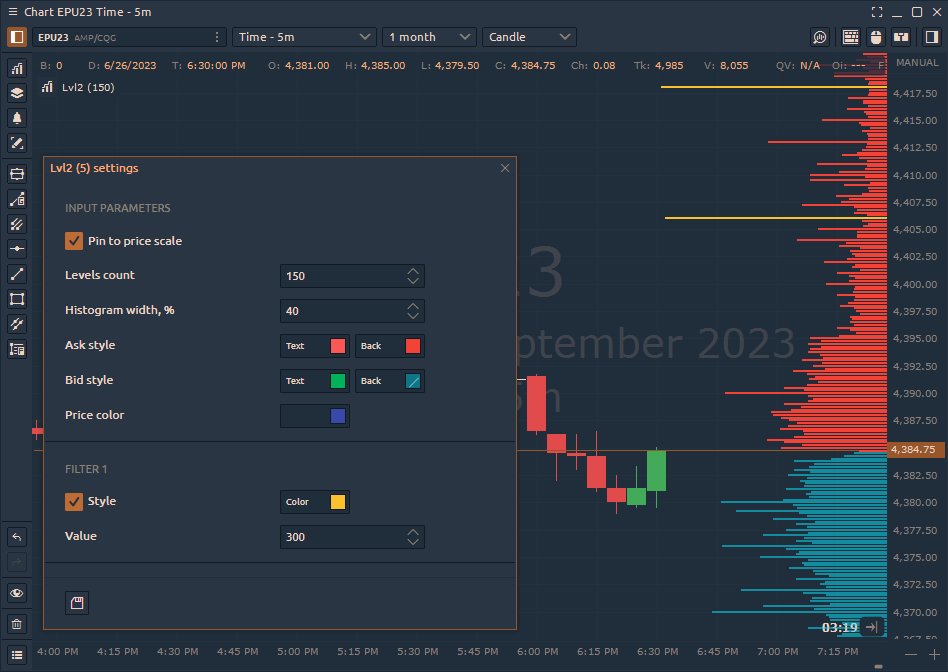
Improvements in Level2 indicator
The latest updates to the Level2 indicator in Quantower bring some visual improvements. You now have the ability to customize the font settings for price levels and the appearance of the indicator's histograms.
Furthermore, in previous platform versions, we introduced the option to set colors for levels that exceed the values specified in the filter. This feature enables you to instantly identify the location of significant limit levels on the chart and gain insights into potential price movements.
With these enhancements, analyzing the Level2 data becomes even more intuitive and informative.


Comments