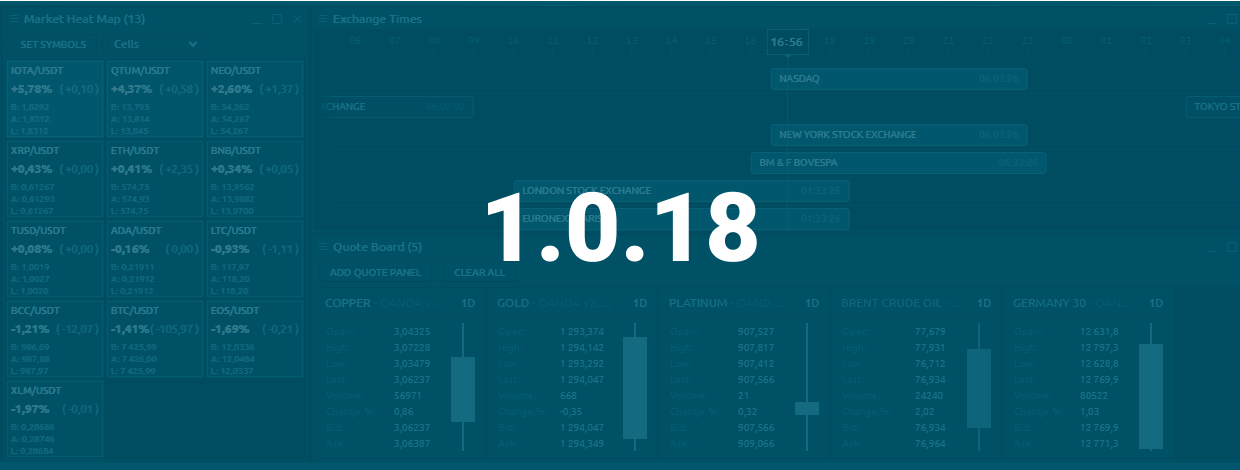
Quantower v. 1.0.18. What’s new?
Navigation
This release mainly brings our traders the set of new plugins for monitoring and analysis of current market behavior and also some functionalities for History management.
Small but powerful features are the ones, that we pay a lot of attention on. That is why we even have a separate team of developers, who put all their efforts on the creation of separate plugins with various, useful for traders functionalities. One of the directions of trading — is monitoring and analysis, and here we have prepared some new stuff for you.
Exchange times panel
Did you ask yourself how much time your Exchange will be opened this day? Or maybe you watching several Exchanges in different time zones and need to convert your local time to Exchange time and back… and need to have several clocks for this… and more troubles like that.
To solve these questions we have prepared an “Exchange times” panel for you. It allows you to see your Exchanges list in beautiful timeline-view and never miss every opening (or close) anymore.
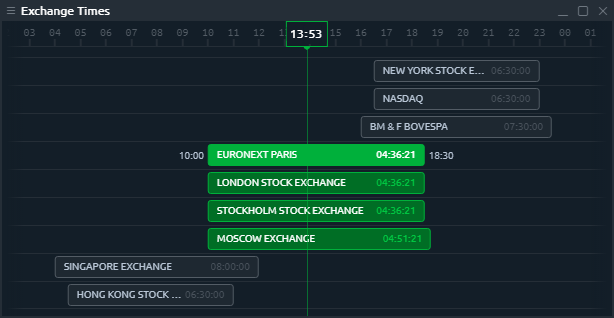
Currently, it allows to select any number of items from the list of 44 exchanges (from America, Europe, Asia & Oceania) and reorder them as you like. Each item has “Time last” value to know how much time you have to make your profitable orders.
Heatmap cells view
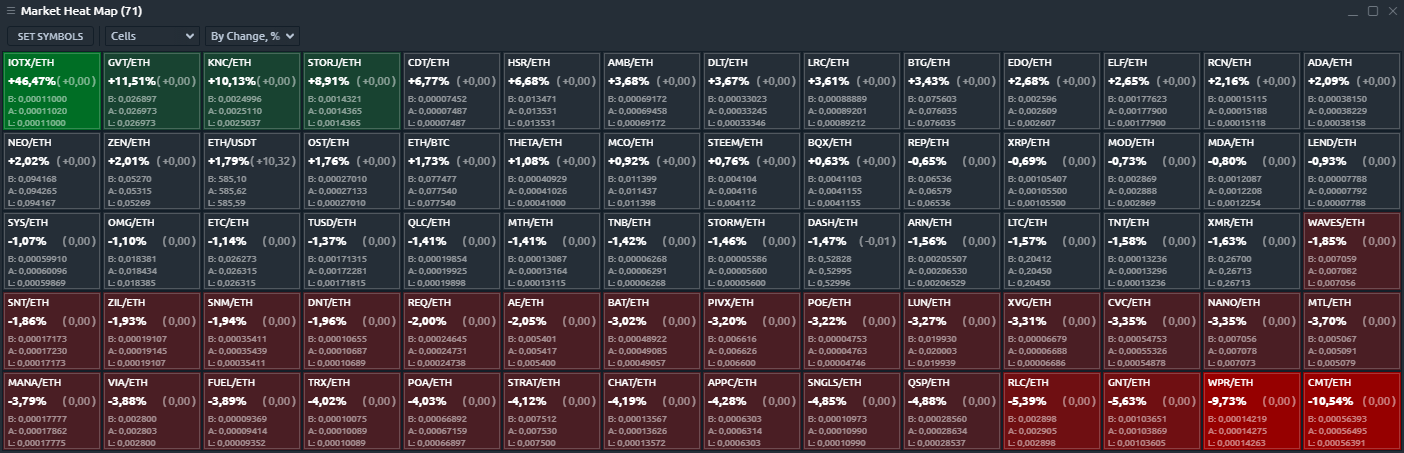
Another feature in this release is more likely an update of previously developed Market Heatmap panel — the great tool for symbols priority monitoring. In case you didn’t use it earlier, this panel collects the data from symbols and displays it in graphical view as well as coloring each item depending on growth/fall state. Parameters for comparison could be "Change" and "Volume".
This update brings you the new view (additionally to the classic Treemap) — Cells. Now each tile doesn’t change own’s dimensions but displays more details about its symbol. And of course, you have an ability to open trading panel with the desired symbol by right-clicking on Heatmap tiles.
Quote board panel
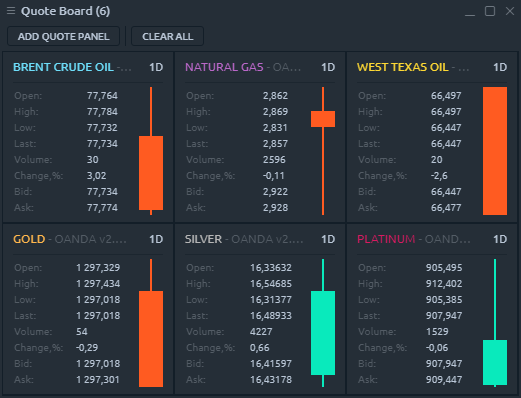
Quote board is another presentation of symbols data, allowing to see the detailed info as well as “candle” or “bar” representation. Up to 8 parameters per quote can be seen on each panel such as: Open, High, Low, Last, Volume, Change (%), Bid, Ask. By the way, you can set up an aggregation period and title color (to randomize the view). Standard colors represent growth or fall.
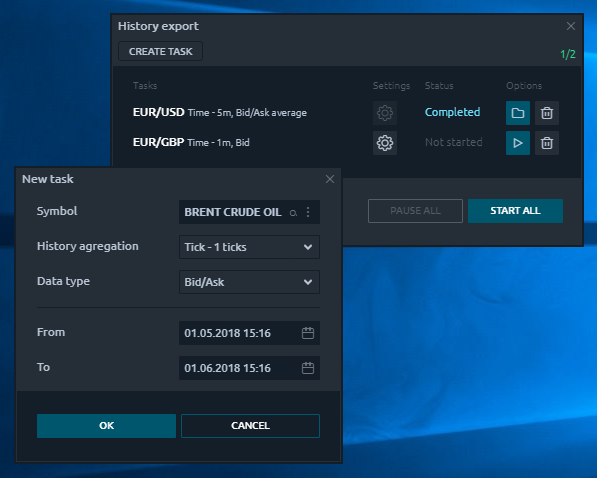
History exporter
The last but not the least addition in the current release is a new history management tool — History exporter. This tiny plugin allows traders to download any available history data for any available symbol on their connection and save it in CSV format. You can use it for offline analysis in Excel or similar applications, for comparison or merge with other parts of history… in other words — any legitimate way. Please notice, that most brokers don’t allow to distribute the collected data to third parties, so honor the laws.
That is all for this release. We did our best to create these functionalities for you, and sure you will like them and use for your successful trading. Please share this news with your friends to let them know about Quantower and use its features in their business. And subscribe to our socials to not miss any update from our team.


Comments