Reading Stacked Imbalance on the Footprint Chart
Navigation
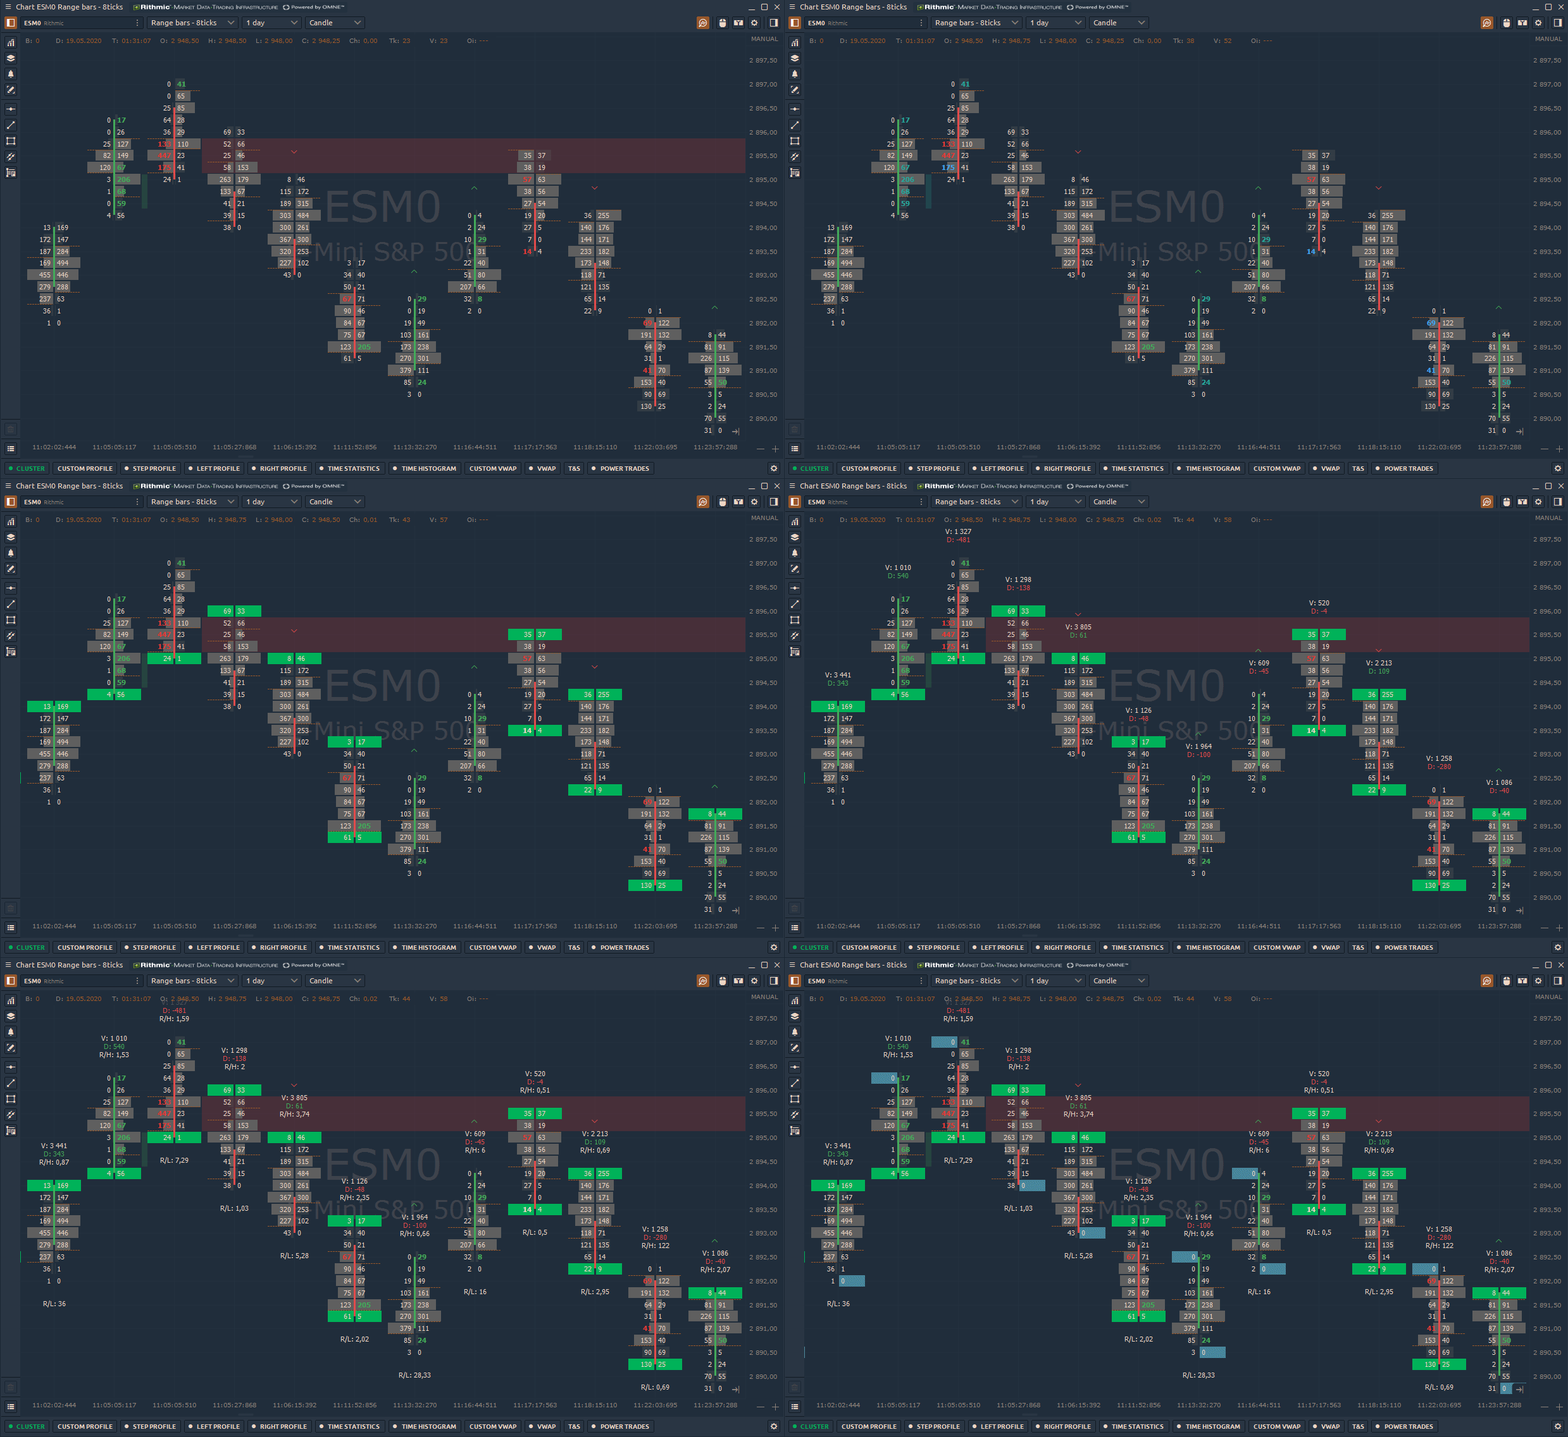
Imbalance on the footprint chart shows where one side's aggression overwhelmed the other — where a market buyer lifted the offer, or a seller hit the bid, hard enough to leave a mark. In Quantower it lives on the Cluster chart's Imbalance mode. This guide walks through how imbalance is calculated, how to set the ratio, and how to read stacked imbalances and unfinished auctions — including the moment a stack means momentum and the moment it means absorption.
How Imbalance Works on the Footprint Chart
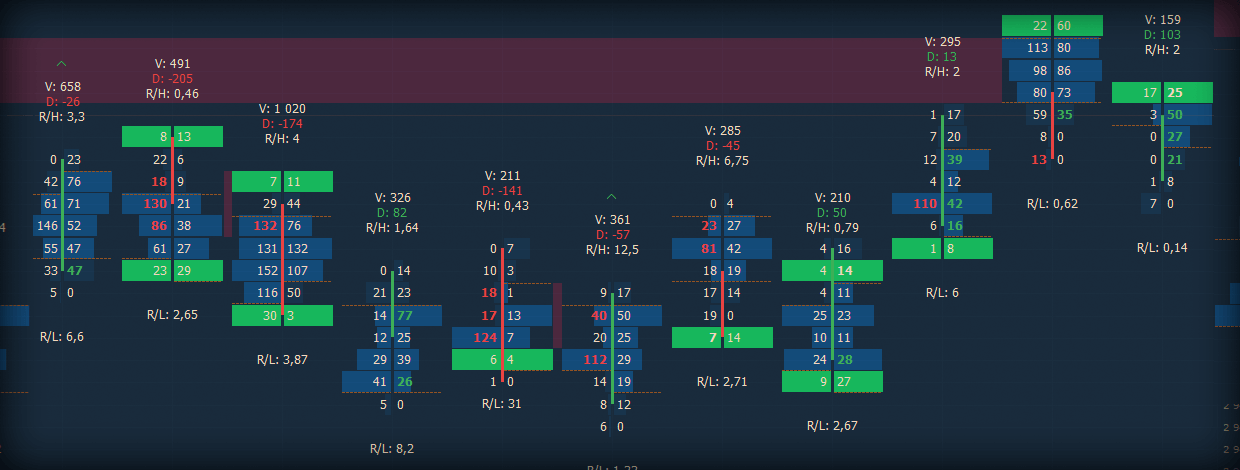
A footprint chart — called the Cluster chart in Quantower — shows the buy and sell volume traded at every price level inside a bar. Imbalance is the point where one side's aggression clearly outweighs the other: aggressive buyers lifting the offer, or aggressive sellers hitting the bid.
Quantower reads it as a diagonal Bid/Ask imbalance — it compares the two sides one level apart, so the spread doesn't distort the read. Buy volume at the ask is measured against sell volume at the bid one level below, and sell volume at the bid against buy volume at the ask one level above. Where one side runs far past the other, Quantower highlights the level.
That answers a question a candlestick can't: not just that price moved, but where someone had to pay up to move it, and how hard.
Setting the Ratio
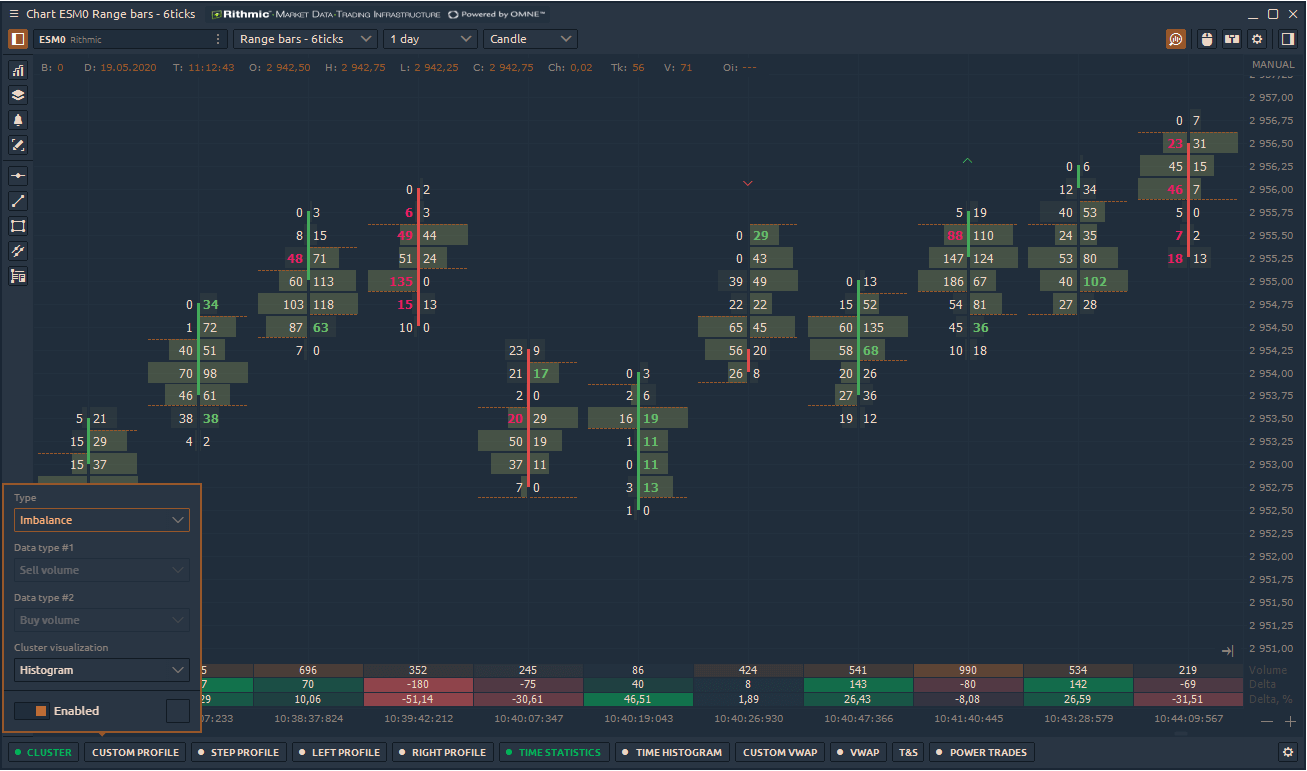
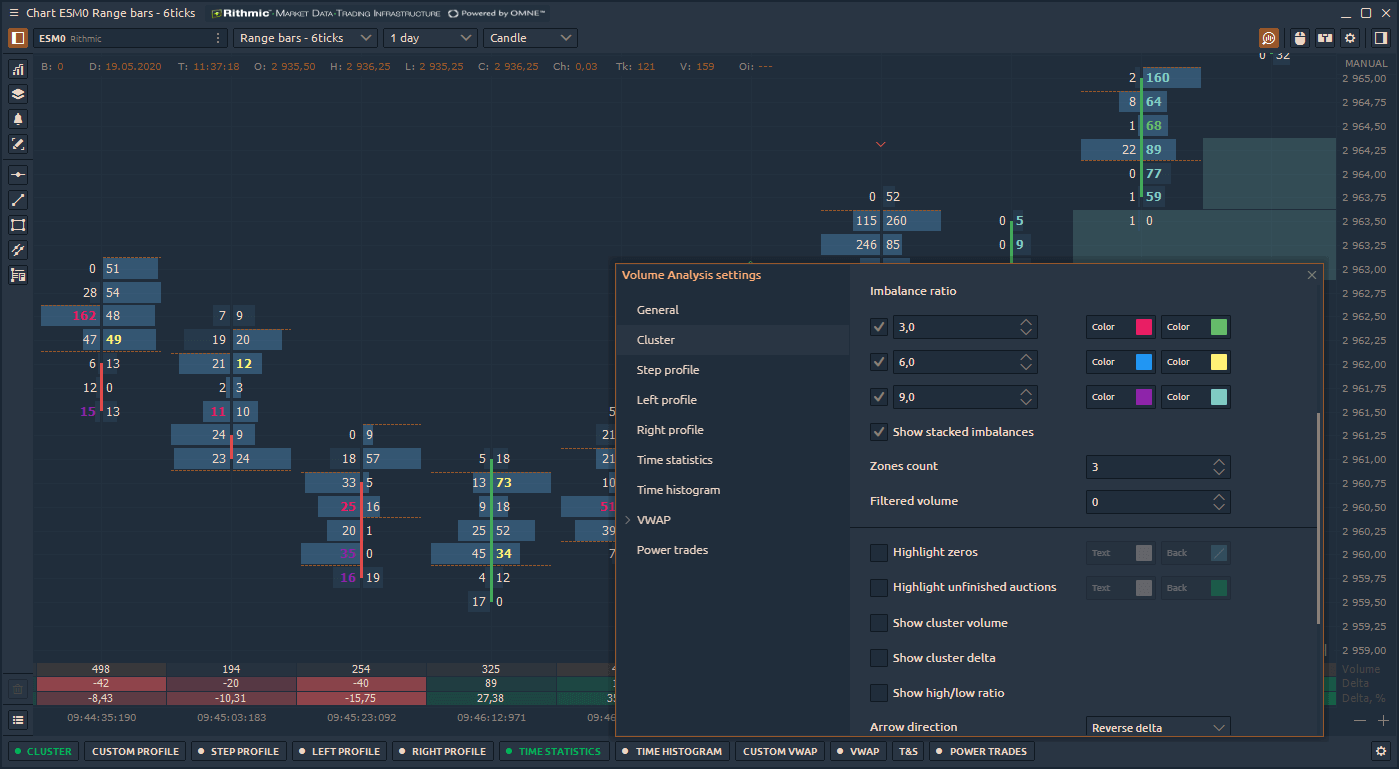
The ratio is the threshold that decides how lopsided a level has to be before it counts. Set it to 3 and Quantower highlights every level where one side traded more than 300% past the other. Lower it and the chart fills with noise; raise it and only the most violent prints survive.
You can set several ratio levels at once and color each one, so a mild imbalance and a brutal one never look alike. Most order-flow traders settle somewhere around 200–300% and tune from there.
Reading Stacked Imbalances
Stacked imbalances are several imbalances on the same side across consecutive price levels — a zone where buyers, or sellers, pushed hard and repeatedly to get filled. Those zones tend to become support or resistance, because when price returns the same participants often defend them again.
What happens on the retest is the real signal. If price slices back through the stack, the aggression was genuine and momentum carries. If it stalls against the stack instead, you're usually seeing absorption — a large passive limit order soaking up the aggression while the aggressors get trapped, which often precedes a reversal. Read the retest, not just the stack.
Unfinished auctions
An unfinished auction — also called unfinished business — is a bar high or low that still shows volume on both the bid and the ask. Buyers and sellers were both willing to trade at the extreme, so the auction never closed, and those open levels tend to act as magnets that pull price back. Traders often use them as logical targets.
A finished auction is the opposite: the extreme prints volume on only one side. No one is left to trade against, so the move can stand.
Imbalance and delta
Delta is the net of a bar — offer volume minus bid volume — positive when buyers were the aggressor and negative when sellers were. Cumulative delta (CVD) tracks that running total over time. Imbalance and delta work together: imbalance shows where the fight happened at a single level, delta shows who won the whole bar.
Both sit alongside the profiles and DOM Surface in Quantower's volume analysis tools, and the same read works across futures, stocks, and crypto on any connected market.
Turning on Imbalance in Quantower
- Open a chart and click the Magnifier icon in the top-right to bring up the Volume Analysis Toolbar.
- Add a Cluster chart from the toolbar.
- Set the cluster type to Imbalance — sell (Bid) volume sits on the left of each bar, buy (Ask) volume on the right.
- Choose your ratio and levels, then pick colors that make the strong prints stand out.
From there it's reading practice: where aggression stacked, where an auction stayed open, and how price treats those levels the second time around.
English
Trade with Quantower
Download the latest stable version of Quantower application for Windows for free and without registration
Comments