Polygon.io data feed, Binance OCO order and Elliot Wave drawing
Navigation
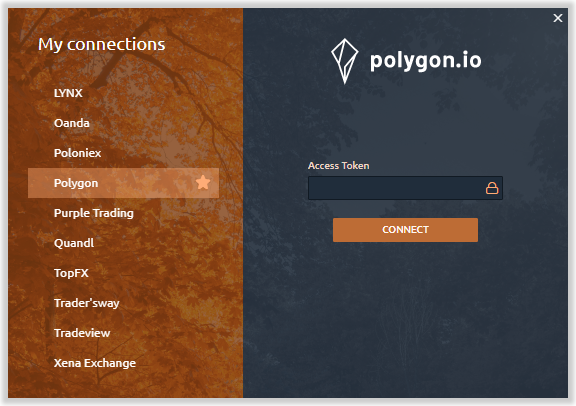
Connection to Polygon.io data provider
By the numerous requests of our users, we have added Polygon.io that provides Real-time and Historical Market data for several asset types — US Stocks, Cryptocurrencies, Forex.
- Data for 24K + Symbols of US Stocks is presented with 16 exchanges and history depth of 20+ years Quote and Trade ticks.
- Polygon offers global currency pairs from around the world. Over 1100+ currency pairs streaming in real-time.
- Level 1 and Level 2 data from 22 crypto exchanges with coverage of 12+ Crypto Pairs
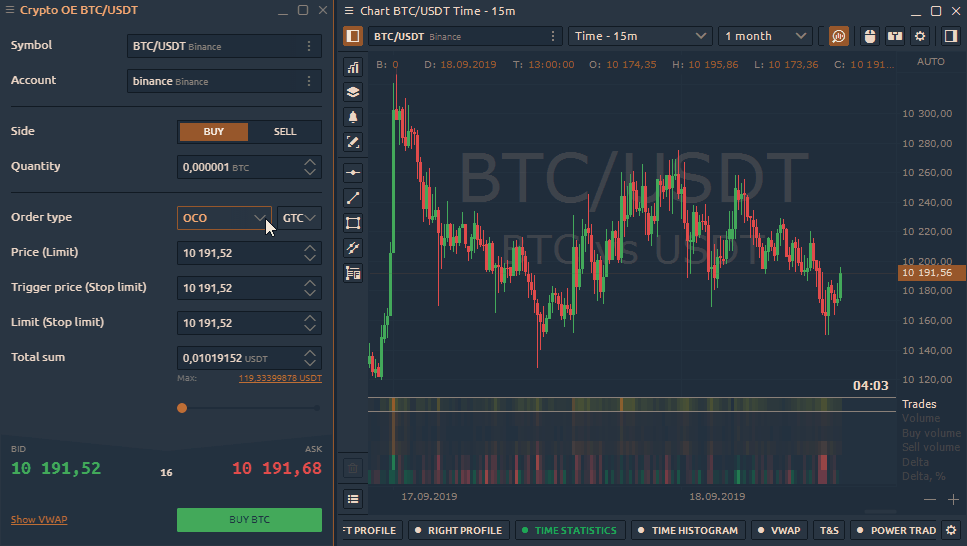
OCO Orders for Binance exchange
A month ago, Binance added support for OCO orders (One-Cancels-Other), which are a group of Limit and Stop-Limit order types. When either one of the orders is executed, the other one is automatically canceled. And when canceling either one of the orders, the entire OCO pair is canceled. In this release, we have also added this type of order for our users.
How to create an OCO order on Binance?
For Buy OCO order, the price for limit order < current market price. Also, the trigger stop price > market price.
For Sell OCO order, the price for limit order > current market price. Also, the trigger stop price < market price.
Select OCO from the drop-down list of orders, then specify the price of the Limit order, as well as the price trigger for the stop order and the price of the limit for the stop-limit order. Specify the order volume, then click the Buy (or Sell) button to place the order.
New indicator Delta-Rotations
The Delta-Rotations indicator plots in real-time the accumulated aggressive orders of the market participants on each rotational move through the delta. As a result, it allows the detection of shifts between supply and demand through the relation of the height of the bars to their corresponding price and the elapsed time.
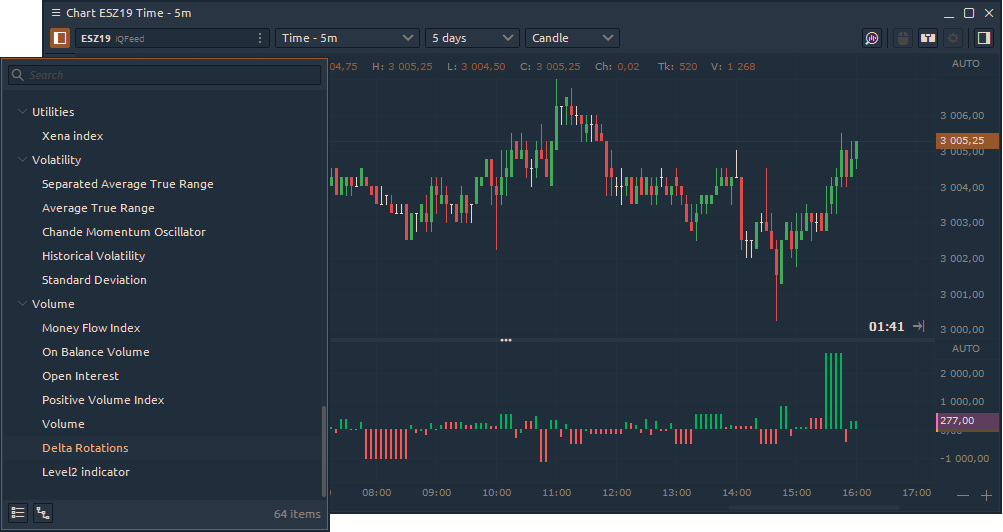
In the case of an up move (upward trend), the long elongated structural move will show sustained demand through considerably high bars. On the other hand, pullbacks will show relatively low supply through a shorter rotational move represented by lower selling aggression.
Higher moves with decreasing overall demand (declining delta rotations) show exhaustion through reducing buying pressure and are signs of potential reversals.
The same concepts apply for down moves with dominating supply/selling aggression and decreasing demand/buy aggression.
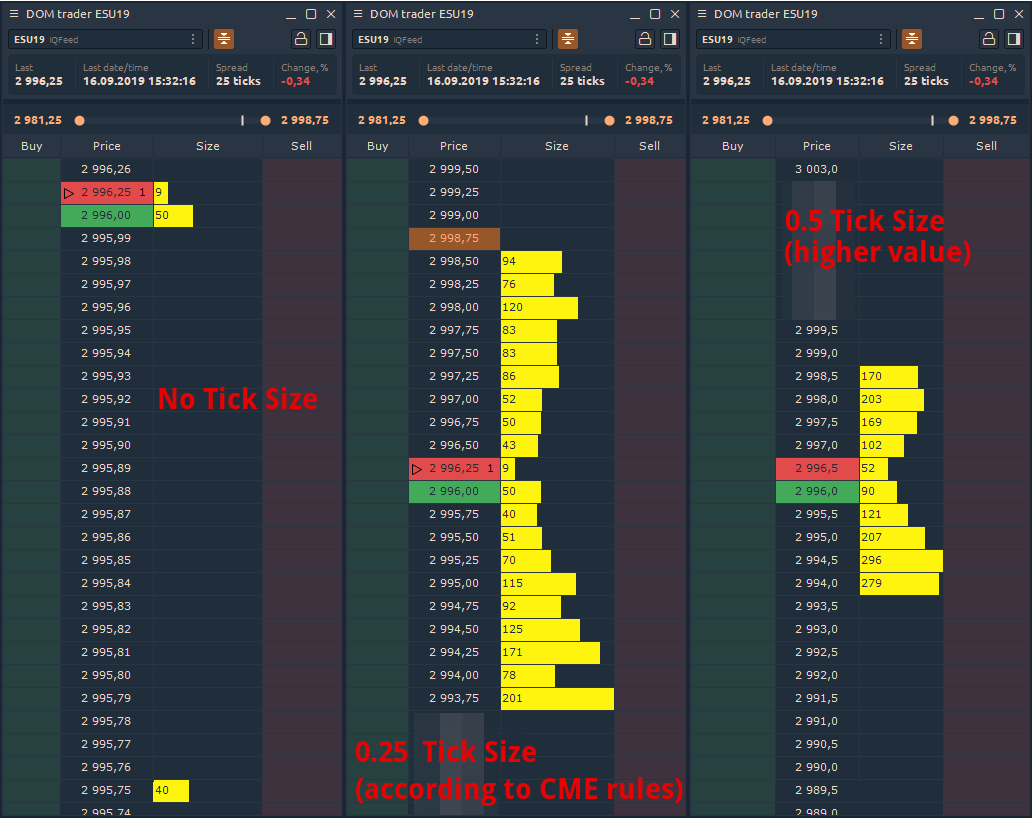
Custom Tick Size for DOM Trader
In the previous release, we have already added custom Tick Size for Chart and DOM Surface panels. Now it is available for DOM Trader panel as well. For those who missed the previous release, we remind you that this setting "aligns" all levels in DOM to the required tick size.
For example, some data providers and exchanges do not provide the minimum value by which the price of a trading instrument changes. As a result, the price scale uses the wrong value of the price, creating gaps.
Take a look at three screenshots. On the left without Custom Tick Size, on the middle screenshot with this setting. If the tick size is set higher than the minimum or specified by the exchange, the Level2 data will be aggregated like on the right screenshot
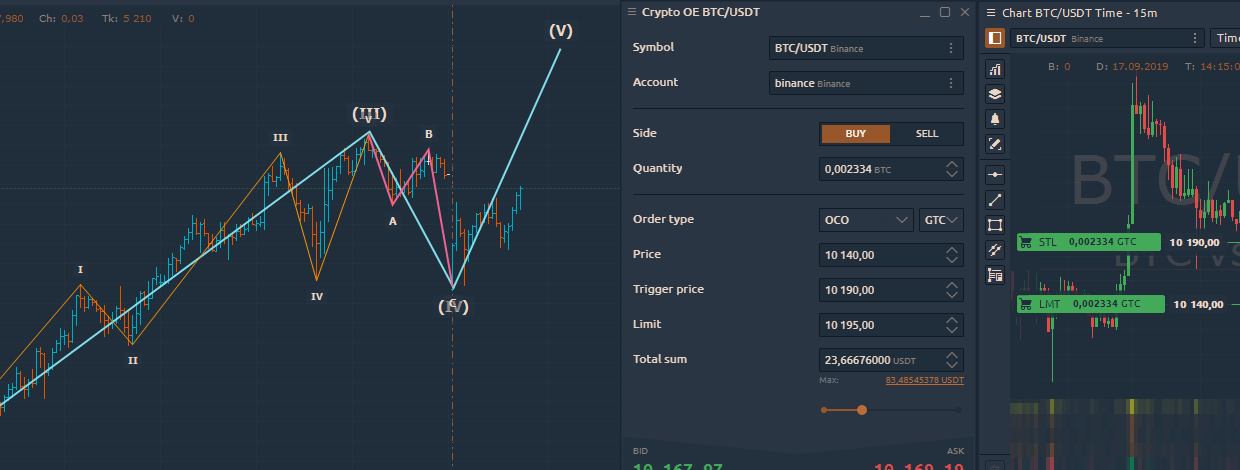
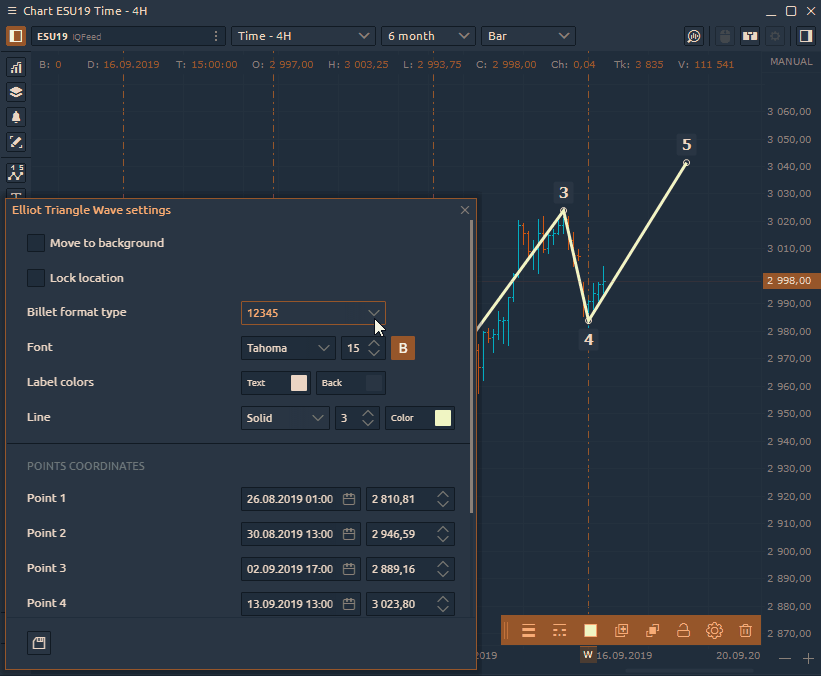
Added Elliot triangle Wave, Triangle pattern, Three Drives pattern
Elliot triangle Wave
Elliot Wave is a popular theory in technical analysis, which is based on the cyclical behavior of the price. Using Elliot Wave drawing, you can graphically identify the waves to determine the correction or trend reversal.
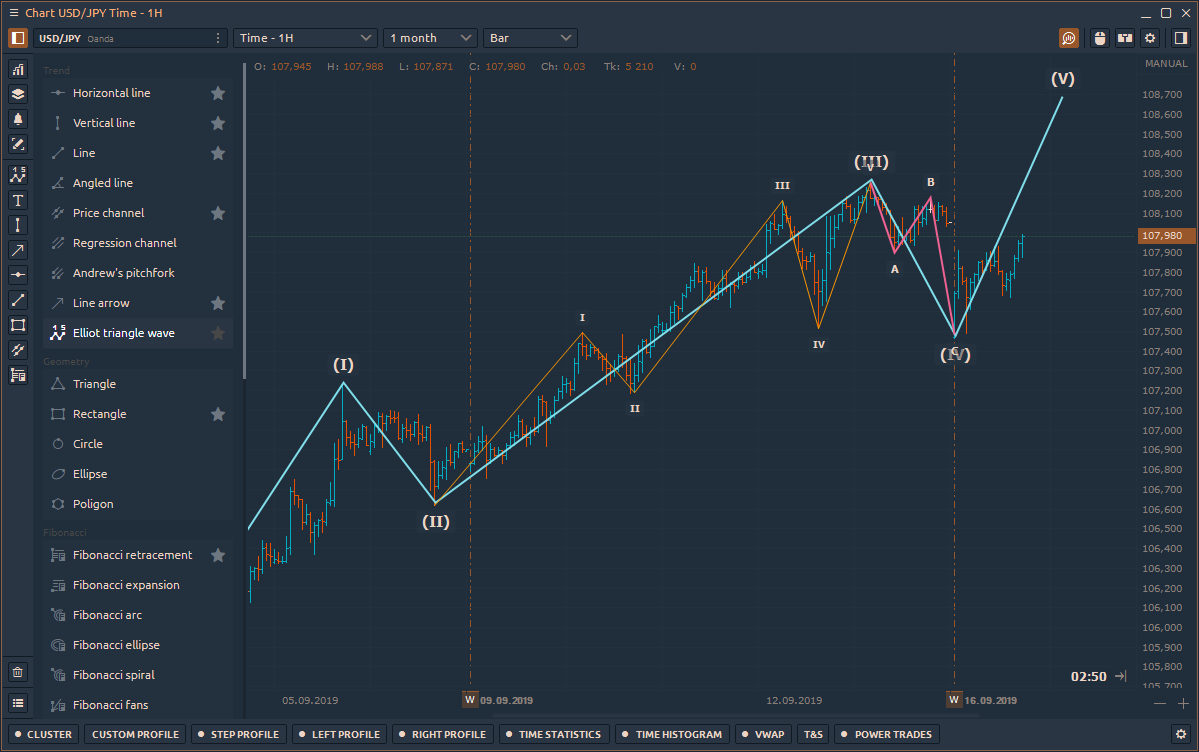
In the drawing settings, you can select the type of wave marker to indicate different types of waves on one chart — Cycle, Primary, Intermediate etc.
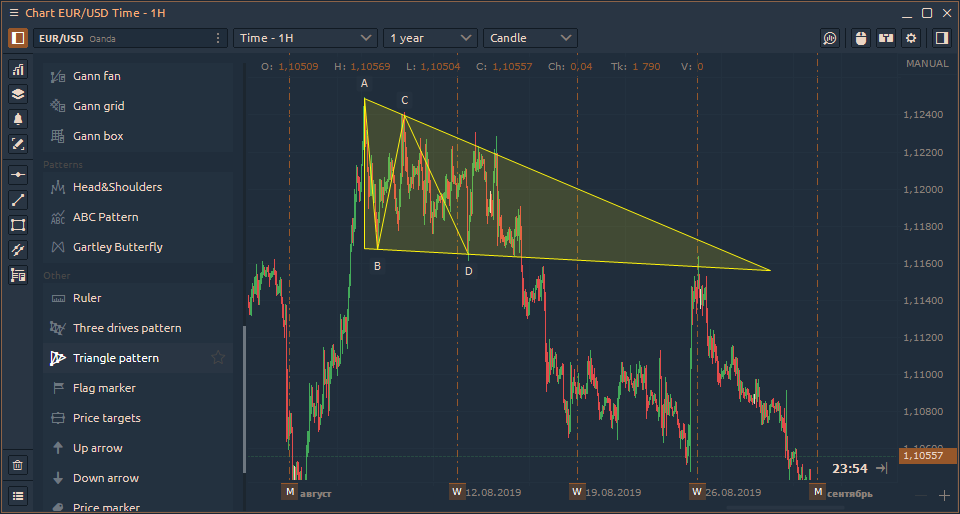
Triangle pattern
Triangles are a popular technical pattern that analysts frequently use to anticipate potential price reversals. The Triangle Pattern drawing tool allows you to plot four points (A, B, C, D) in order to overlay a triangle onto the candlesticks of a price chart. The idea is to place the points on four alternating highs and lows. That is to say, points A and C would be on consecutive highs (or lows) and B and D would then be on consecutive lows (or highs).
Three Drives pattern
The Three Drives Pattern is a well-known harmonic chart pattern that consists of a series of three higher highs or lower lows, which signals a potential reversal.
In the classical bullish version of this pattern, there are three drives or pushes in the upward direction. After each push, there is a retracement of 0.618 Fibonacci retracements of the previous drive.
The next drive needs to end near the 1.272 Fibonacci extensions for the price action to qualify for the pattern. When the price gets close to the drive 3 point at the 1.272 extension, you would put in an order to sell.
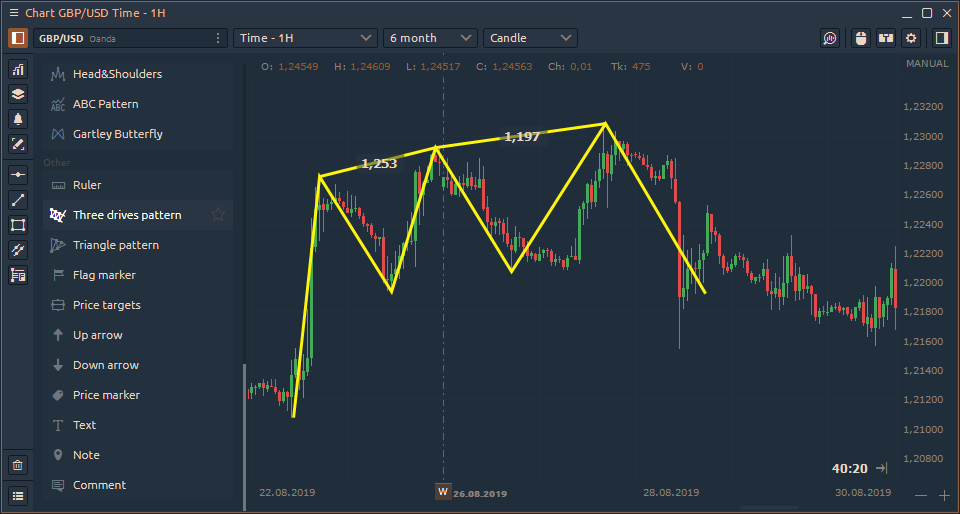
Your target would be the 0.618 retracement of the entire move from point zero to the top of drive 3.
Then, of course, the classical bearish pattern is the same thing, but upside down.
English


Trade with Quantower
Download the latest stable version of Quantower application for Windows for free and without registration
Comments