Plugin for manual backtesting — a brief review of Market Replay

Navigation
Testing of trading strategies is one of the most important and necessary steps for successful trading. Even if you have a simple trading strategy or a trading idea, you need to be completely confident in its efficiency, and also have a clear idea of its shortcomings. But how do you find it out? The answer is simple - you need to conduct testing!
As you know, there are two ways to test trading systems — automatic and manual. To conduct automatic testing, there is a large number of algorithmic trading software, which allow you to perform not only the testing of stocks, futures, and options but also currencies and ETFs. However, for proper backtesting, you need to have experience in writing trading scripts and advisors, as well as understanding all the pitfalls associated with testing and optimizing trading strategies. If you are an experienced algotrader, then the automatic testing method is ideal for you.
But unfortunately, many traders don't know the programming language, which makes testing their strategies difficult. Therefore we've created a Market Replay panel.
What is the difference between Market Replay and other backtesting software?
The Market Replay panel is the ideal solution for conducting manual backtesting of currency pairs or exchange-traded assets. The great advantage of Market Replay over other Forex Backtesting Softwares is that you can:
- conduct testing using your indicators and drawing tools directly on the chart
- test several instruments simultaneously (!)
- make tests on different connections from our list simultaneously (!)
- test on different types of charts — Time-based charts (Bars, Candles, Lines), Ticks, Renko, Point & Figure, Heiken Ashi, Price Range
- use not only the Chart panel in your tests but also Depth of Market and Time & Sales
- check your trading ideas with the TPO Profile chart
- set different time frames for one or several instruments
- test on exchange-based and custom spreads
- export the history of your transactions in Excel for further analysis

How to manually backtest trading strategies using Market Replay panel?
Before you start testing your strategy, let's customize the Market Replay panel.
- Launch the Market Replay panel from the main menu.

- Add a trading instrument for which we will conduct testing. For example, let's select AUD/USD and set 1-minute data aggregation. It is possible to select tick, minute and day aggregation of data, on the basis of which we will conduct testing. Leave the default data type - Bid/Ask/Last. For faster testing, only the Last values can be set, but the test results may be inaccurate in this case.

- Select the testing range, and also set the initial balance of $10,000 in the module settings. Note that after adding each new instrument (symbol), it is assigned a separate trading account. So, the corresponding account, for which you can set your own settings, was created automatically for the AUD/USD instrument - Netting Type and commision size for each position.
Position's netting type (within the same trading instrument):
• One position - it is possible to open one position for one instrument in one direction in this mode. If you previously opened a position to buy 1 lot, adding a position to sell 1 lot will close the previous position. New trades for buy will be summed by volume, and the entry price will be averaged.
- Once we have selected the instruments and configured the initial parameters, click on the “Start” button to start testing. When the testing is started, the "Start" button will be changed to "Stop" button.
Now open all the necessary panels for our testing by clicking on the button “Open panel”.
- Create your custom workspace and start testing by placing orders and see how the strategy works. You can change the speed of testing, pause it or make one tick forward by pressing F12 or the button “One Step Forward”

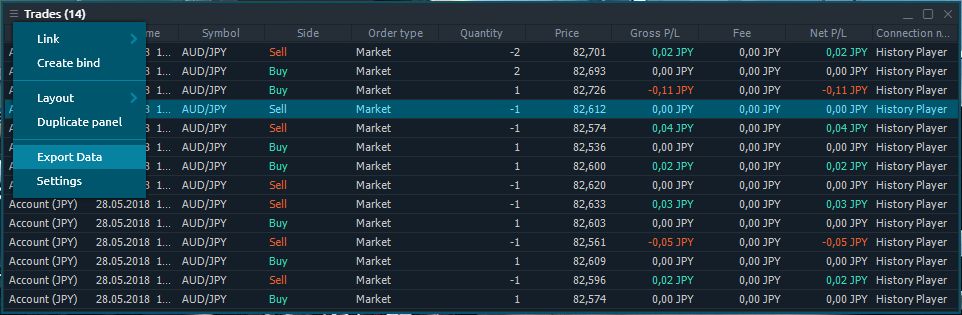
- Place your trading orders via chart trading, mouse trading mode or via different panels like Order Entry, DOM. The history of trades and their results can be viewed in the Trades panel.


How to analyze backtesting results?
After testing is completed, we need to analyze the result of our trading strategy. To do this, we run the Account info panel, which shows account Balance, its Equity, current open positions, Profit & Loss data.
The difference between the Balance and Equity is that the Balance shows data only for closed trades, and Equity shows the result given the unrealized P/L (i.e. open trades are taken into account).
An additional analysis of the strategy backtesting results can be done in Excel, where you can upload all your filled trades using the export from the Trades panel.
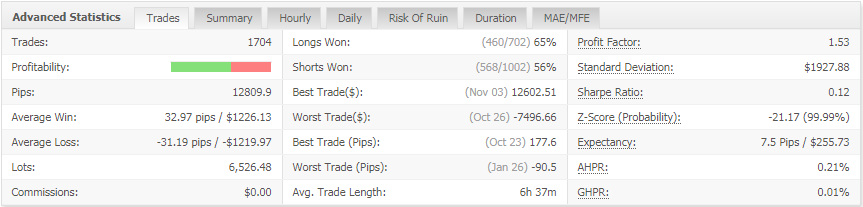
After the data has been exported, you can open it in Excel and analyze the additional parameters of the system: Profit Factor, Average Profit or Loss trades, Sharpe and Sortino Ratios, Max Drawdown etc.
Soon we will add the Account performance panel that will allow you to immediately analyze the test results with all the necessary statistics.


Comments