TPO Profile chart and Trading on BitMEX exchange. Check out new features!
Navigation
Here at Quantower, we continue to develop new features, add more connections and of course new panels for your better trading. Therefore, in this release, we are super excited to present a completely new panel — TPO Chart.
Trading on BitMEX exchange
Previously, we've connected to BitMEX crypto exchange and it lets you analyze digital currencies and futures in Info mode. This allowed you to use BitMEX data without the API & Secret Keys.
So today we are happy to announce that we've added Trading on BitMEX. Now you are able to enter your personal API Key & Secret Key to trade main cryptocurrencies and their futures.
TPO Profile Chart (a.k.a. Market Profile®)
Time Price Opportunity or TPO Chart, shows the price distribution during the specified time, thus forming a profile. This allows you to understand at which levels or ranges the price has spent the most time, as well as to determine the main support and resistance levels.
Let's take a look at the most interesting points of the TPO chart panel.
Building a TPO Profile for any time period
The base element of the TPO chart is letters that are used to build the market profile structure. Each letter initially represents a half-hour period. Quantower offers to specify in the aggregation settings any values on the basis of which the profile will be built. For example, a daily profile of 30-minute bars is considered as a “standard”. But you can set a lower value of “Build From” and the profile will be more granular. Conversely, set the value higher and the shape of the profile will be smoother.
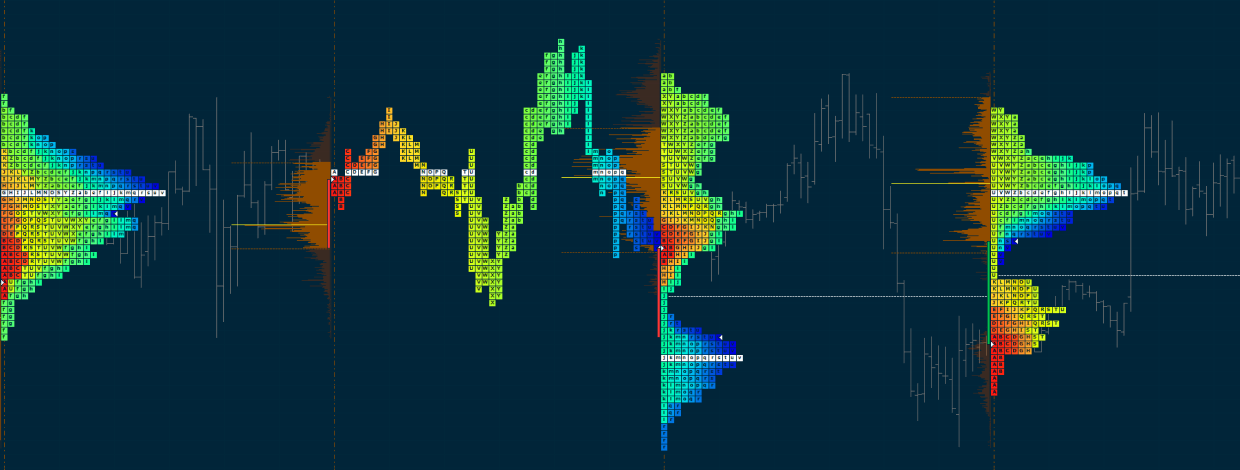
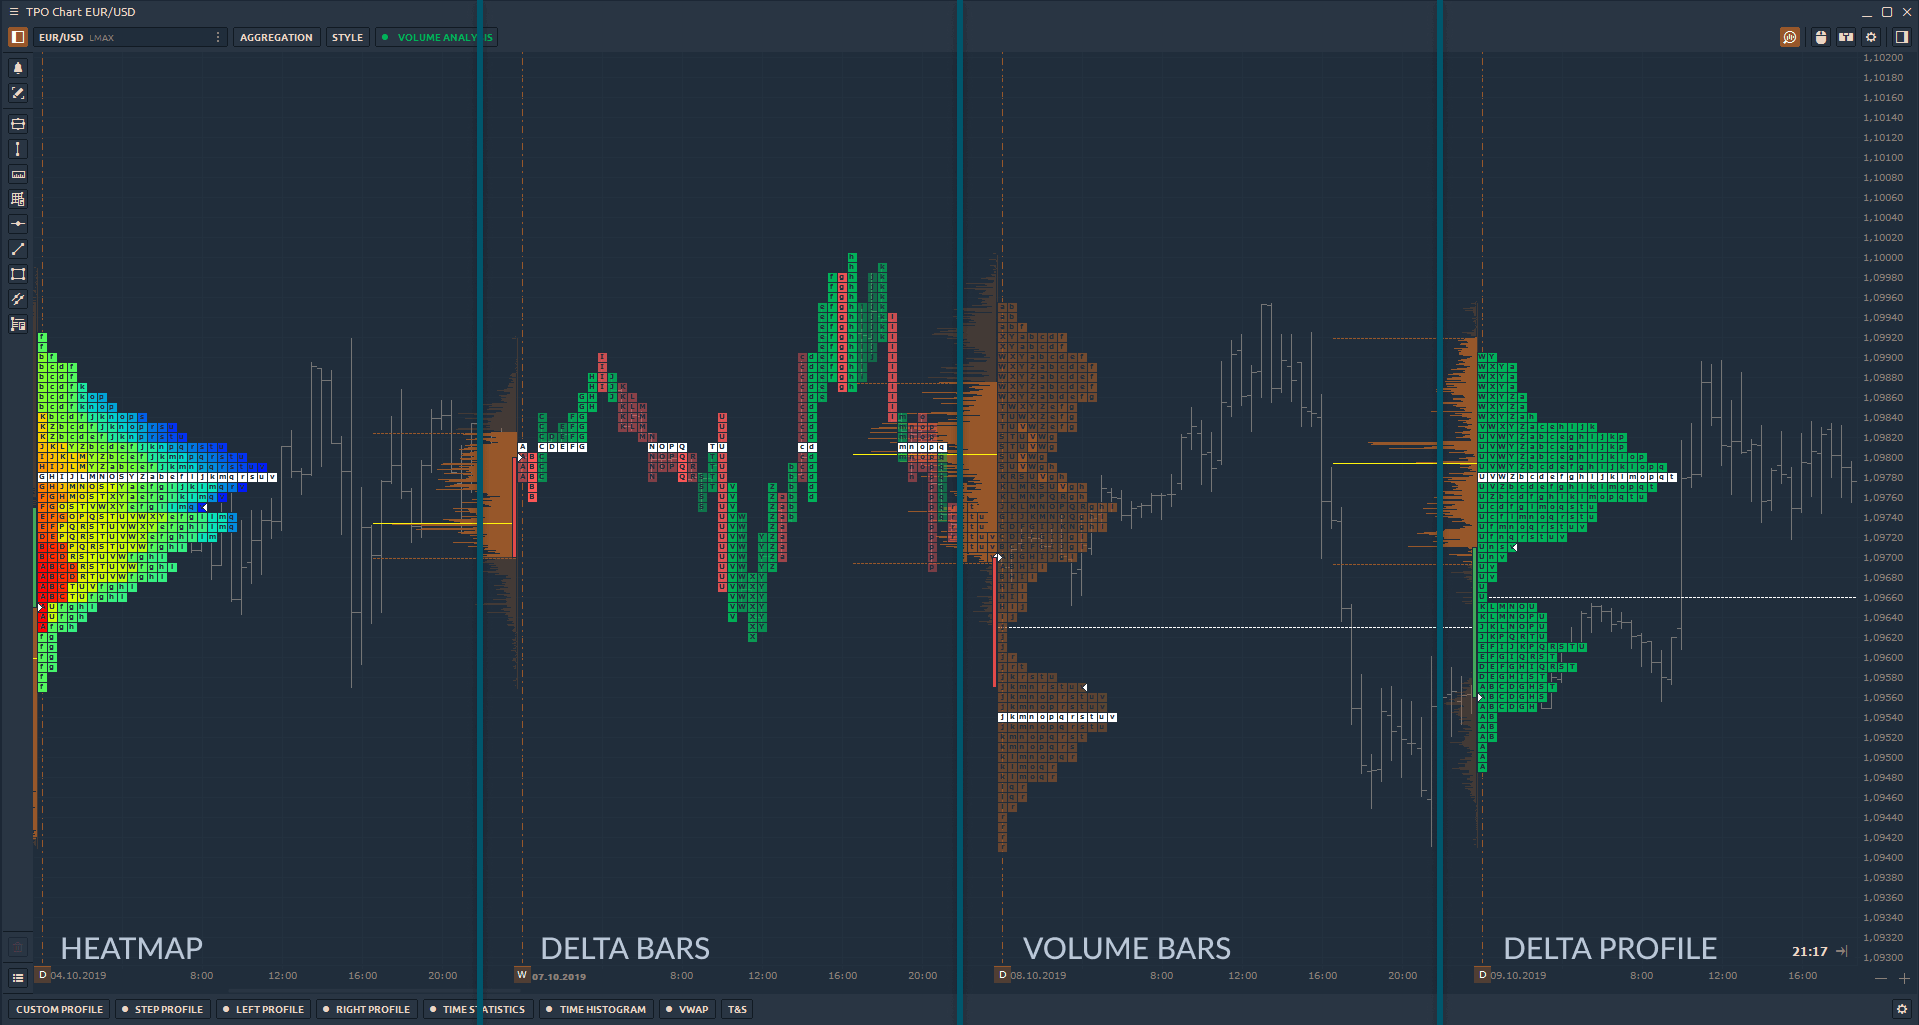
10 coloring modes for profile visualization
Choose any color scheme for better representation and analysis of the TPO profile. Currently, there are 10 different coloring modes available — Single Color, Up/Down Profile, Up/Down Bars, Heatmap, Delta Profile, Delta Price, Delta Bars, Volume Profile, Volume Price, Volume Bars.
Key elements of TPO Profile — POC, Value Area, Singles
In the profile style settings, enable the main elements for precise analysis:
Point of Control (POC) — price level of the greatest market activity or trading volume. At this level, the price spent most time over the profile range.
Value Area — price range in which approximately 68% - 70% of the market activity or trading volume took place.
Singles or single prints of the profile are placed in the middle of a profile structure, not at the upper or lower edge. They occur on impulse movements and are used as support/resistance zones, which the price can test in the near future. The singles line indicates where the singles begin to form (in cases when there are several single prints).
Overlaying the standard chart over the TPO Profile
In the Style settings of TPO Profile enable the “Plot Symbol” option for displaying the standard chart and apply any drawings for technical analysis.
Splitting & Merging the TPO Chart
Use splitting for a detailed analysis of profile formation. There are two splitting modes available in the platform:
- Split full profile, that separates the profile into each bar or TPO;
- Divide by bar, that splits the profile in half on the selected bar.
To separate TPO, select the necessary profile and click on the Split button (or use right-click to open the context menu)

Merge is a feature that combines several profiles into one. Right-click on the selected profile to open the context menu and select Merge Left or Merge Right. To return profiles to their original positions, press the Reset button.
Using Volume Analysis tools
TPO profiles are used on their own to find areas of support and resistance, and can also be used in conjunction with volume profiles. For this, we have added Volume Analysis control to the top toolbar of the panel. Here you can select the data type and show/hide the POC & Value Area.
In addition, we have left our standard volume analysis tools, which let you add Time Statistics & Histogram for bar analysis, VWAP, and other tools.
Setting the Session Time
Set the custom time range for the necessary trading session and the profile will be built within this range. The rest of the time the profile will not take into account
TPO Profile chart panel is available as a separate license as well as for all users with the All-in-One license.
Access to 3d-party extension "Trading Personal Assistant (TPA)"
Every day our trading platform becomes popular not only among individual traders but also among community leaders. As a result, they start to develop their own trading systems and plug-ins.
We are glad to inform you that now on our website on the Pricing page of the separate category there are extensions of our partners. At the moment, the Trading Personal Assistant (TPA) extension is available, which was developed by the 3rd Dimension team. More details about TPA and how it works, please read on their website.
What do you think of this Quantower update? Have an additional feature request? Tell us the one thing you are still missing when working with our platform.
Please, stay tuned to receive our updates:
via email — sign up to Quantower account (even Free) automatically subscribes you to our email base;
via Twitter channel;
via Facebook.
English


Trade with Quantower
Download the latest stable version of Quantower application for Windows for free and without registration
Comments